Australian (ASX) Stock Market Forum

How to Trade or Invest Profitably - "Without The Bullsh*t" - Technical Analysis Step by Step Tutorial Plus Q&A Thread

tech/a

No Ordinary Duck
Joined
14 October 2004
Posts
20,400
Reactions
6,317
Can I ask that you please keep this sort of discussion separate to the Original thread

The initial thread requires some for some a degree of learning and understanding
To that end over time I will present and discuss with those interested the Basic and
more advanced T/A required to trade this method and no doubt help you in those
you work on yourself. The initial topics will be


Reading bar charts

(1) Individual Bars.
(2) Volume
(3) Gaps
(4) Volume Control Bars.
(5) Fixed Fractional Position sizing.
(6) Pattern identification ---That I look for NOT EVERY pattern known!
(7) Support and Resistance.
(8) Trade Management relative to MY Discretionary METHOD
(9) Outlier Moves.
(10) Constructing a Watchlist.
(11) Finding Prospects.

PLUS anything else related to understanding the Trading method
that people bring/ask about.

If you have anything pressing now you'd like to bring up please begin!
Don't be afraid to post many maybe thinking the very same thing!
Hi Tech,
I for one really appreciate the effort you are/have put in to help educate others around your trading style. One question I have regarding charts is I often see yourself and others post charts that have notes and markings on them that I assume stay there as you continue to monitor the chart. I currently rely on taking paper notes and this becomes cumbersome or forgotten over time. This may seem quite basic, but I'm not sure how to go about setting up this kind of function, without creating a new chart each time and cutting and pasting. Any guidance in note taking/marking a stock with charts over a time period would be informative for me. Thanks, Craig
 
Hi Craig

2 ways
(1) Amibroker has a rudimentary notation group of functions. ( mainly use that but has limits)
(2) I Use PAINT (Download it) for better notation but you need to photograph then note up.
 
Hi Craig

2 ways
(1) Amibroker has a rudimentary notation group of functions. ( mainly use that but has limits)
(2) I Use PAINT (Download it) for better notation but you need to photograph then note up.
Thanks Tech,
I'll look into these options. I take it though that you would have to keep separate snapshots along the journey rather than the notes staying imbedded on a chart that you continue to follow? Craig
 
Amibroker or any charting Package will generally keep the notations when you re open.

If using paint its a one off .
 
Lets get into it.

When I look at a chart I want it to be BLATANTLY obvious that what I SEE is screaming BUY
SELL
doesn't have to be screaming (But it often does) it has to indicate to me that things
are definitely changing.

My aim is to keep this super simple because good trading is.

When you look at enough charts you'll see IT instantly and it can be quite a few different things.

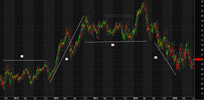
You NEED to know in what season of the chart this is happening.
(1) Accumulation
(2) Bullish up move
(3) Distribution
(4) Bearish down move.

You should be able to see this instantly.

Higher highs and higher lows Lead to a move up
Lower Highs and Lower Lows lead to a down move
(Generally)

4 Seasons.gif


NEXT

Single bar interpretation
by them selves and in Clusters.
Some excellent reading you should download and print out.


I have trouble differentiating 1 Accumulation and 3. Is it something determined down the track and not so much as it is happening. I mean could 3 be another accumulation distribution?
 
Accumulation typically occurs after a bear move down
Distribution typically occurs after up trends

I’m pretty sure your issue is in areas of consolidation.
Is the consolidation distribution OR accumulation.

The short answer is consolidation areas are BOTH
they are again typically SHORTER in duration With
clear direction coming out of it.
will cover at some point V/C bars are part of it.
but not all cons9lidations are under a V/C bars
control.
 
As a Chartist I have a number of searches which pop up charts that have price movements
that are highly unusual. These are the pre curses to moves. The first words to the story.
The opening lines.

Here is a group of Bars that would and some did have me load in a buy or (Sell) or place in
my watch list these are what we look for. Ill explain as we go with more time.
You can see they are obvious in their own context.

Bars to look for 1.gifBTLF 1.gifBTLF 2.gif
 
A bit of FYI.
Please check your charts aren't colored the same way!!

Wrong Marking of bar.gif
 
Now to the really important stuff.

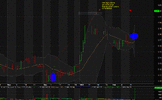
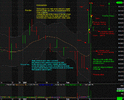
Below is a chart marked up with very special notes
Take time to read and absorb it as the notes are important
to your understanding of how I read charts. This is MY 101

Every bar has a story sometimes its boring and other times
its compelling. Bear with me as we put this all together in
chart reading methodology (Mine anyway).

I have offset the Green dotted line Range extension which
includes any gap for Clarity.

Have a close look at each individual day discussed and see
how the price action has developed.

Based on what you see what do you think is likely to happen next?
Why do you think that? If you were in the trade what would you do?

If you weren't what would you do?

Answers later.

Bar analysis.gif
 
I will take a stab at an answer. I will probably be wrong and will accept the lesson.
I would check for any news release to explain the uprising price. Also look at history of prices where has this stock been before. Would I be correct in saying the price seems volatile across this chart and that supply is not great? I would expect momentum would be rising probably sharply from a dip
If I didnt have the above and just working off the chart
Place a small position buy slightly above the close. 4.9 or 5.0 and go for a ride trending up. I would not want my offer to be taken at discount if the price should drop at open. (I dont know how to do that). What I am saying I will buy if the continued rise is validated.
@tech/a apologies if I am meant to keep this to myself and check against your answer.
 
Jbocker

All good post up anytime , good to see different
views. The available analysis is by no means exhaustive
but sufficient to be able to anticipate any trading decisions.

My aim is to have people question what the chart is telling them
Cross referencing analysis as its introduced. Getting used to
forming opinions and getting used to the likely results right
not so right and wrong---bar by bar (While your trading or watching
a potential trade in a watch list.)

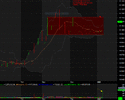
A little past history would help. So here.

Oast history.gif
 
Last edited:
I know this is the technicals thread but I'd be looking for an explanation for the movement(s).

Looking at it long term we're in dead-cat-bounce territory.

Without knowing any more, if I were already in the trade I'd be selling as soon as we got a negative open as that's our first evidence of some kind of pullback. I'd rather be one step too late than 2 or 3 or 15 steps too early.
 
Based on what you see what do you think is likely to happen next?
Why do you think that? If you were in the trade what would you do?

If you weren't what would you do?

I would move my stop up to below the low of the bar that created to gap.
I would wait for a pullback on low volume to create the bar for the entry trigger and stop position.
 
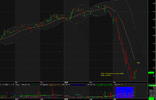
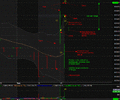
So before I put up the next bar I've marked up a chart with the
important information it tells us leading into the next day of trading.

(1) Very wide gap up indicates that this WAS thinly traded sellers were in short supply
(2) Sellers returned on 2 occasions in droves eager to get out.
(3) At some point supply started to dry up and buyers who wanted a position
had to bid higher right up until the close.
(4) This is reflected in Volume where supply was at its peak on day 1 and diminished
on day 2

Not marked on the chart but very clear is that price has risen over 60%. Very rare for
price to increase over 50% in a very short time so caution.

@over9k I like this strategy
@willoneau like this as well.

If your in the trade you'd be at B/E or better
I would move to the high of BAR (1) the large gap bar. Im expecting to see a strong continuation
OR
Some consolidation and if that appears I want to see the depth of it--the volume involved and the
duration.

If I wasn't in it I'd be on watch lamenting my poor timing or lack of alertness!
Id want proof this is still full of momentum so a stop limit order 3 Ticks above the high so
if it powers off I dont miss it. That will stay there until price action dictates its no longer
valid or there is a better option.

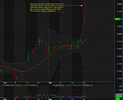
Chart reading 1.gif

Next Next bar
 
What would make you confident of your trailing stop buy duck? I.e if it busts price X, what would make you think it's going to continue surging past it?

This is why I've never really liked stop-loss orders, for all the times they might save you from a plummet, they're more than offset by the times they make you realise the loss/sell in a dip. Same goes for buying on an upswing but the other way around.
 
With the stop limit entry above the high were would the stop loss exit and risk position be?
below the low of bar two or below the close of bar one?
 
What would make you confident of your trailing stop buy duck? I.e if it busts price X, what would make you think it's going to continue surging past it?

This is why I've never really liked stop-loss orders, for all the times they might save you from a plummet, they're more than offset by the times they make you realise the loss/sell in a dip. Same goes for buying on an upswing but the other way around.

Will answer with more time.
With the stop limit entry above the high were would the stop loss exit and risk position be?
below the low of bar two or below the close of bar one?

Depends on the next bar currently Im waiting if in the trade so
I may not have to use it.
 
Top