Australian (ASX) Stock Market Forum

Housing Starts in the US

yeah how bad would you feel if you bought a house for $200K then it went up $100K so you used the equity to go buy consumer goods only to find your house really is only worth $200 K or less :D

I think you would have to be pretty sily to use home equity to buy consumer goods, one things for sure the US conumer 70% of their economy is not going to be able to afford to keep the economy chugging along. They must be kidding if they think a recession isn't coming :D

The only way i can see out of this one would be for the US to adopt slavery again or use its military to just take what it wants / needs. (Iraq :rolleyes:)
 
in regards to oil wastage i would have to say the funniest thing i've seen is people doing paper routes in cars throwing hte papers out the window in plastic sleeves ! :D I mean come on what ever happened to the paper boy !
 
yeah how bad would you feel if you bought a house for $200K then it went up $100K so you used the equity to go buy consumer goods only to find your house really is only worth $200 K or less :D

I think you would have to be pretty sily to use home equity to buy consumer goods,

hello,

so you now have a 100k personal loan at the lowest possible rate, no different to somebody who gets a personal loan to buy consumer goods, car, holiday etc

plenty doing that everyday, everything is credit credit credit, not just housing owners,

cant see US being any different to AUS, as Ken has mentioned, houses will need to be built, at the moment supply maybe too high

thankyou

robots
 
that graph of housing starts , completions and recessions is not indicative of anything. Never before has the housing industry caused a recession its always been the recession causing the downturn in housing construction.

This is a whole new ball game now.

Kiwi,

I doubt anyone would argue that housing downturns cause recessions. However you will notice that housing has turned down noticeably before every recession since the late 1960's. Again that does not indicate housing caused the recession but it is a good leading indicator nonetheless. The downturn was less pronounced in the 2001 recession. That recession as we know was brought about by over-investment in tech related goods

Now we have a huge over-investment in housing with commercial real estate set to follow. I would expect a US recession will probably come even later than usual given the biggest real estate bubble in history has further to unwind.
 
I don't want to turn this into another oil thread as the issue has been discussed elswhere in this forum. But to summarise... :)

1. The tar sands in Canada are sufficient to run the world for about 4 years.

2. Make that 6 years if nuclear power is used to extract the oil rather than burning some of the oil produced to fuel the process. Natural gas is in decline in Canada and is not a long term option despite its present usage for tar sands.

3. It would realistically take 50 years to mine the tar sands. That gives an annual production rate of 6.5 - 10 million barrels per day versus global consumption of about 85 million barrels per day increasing at 1.5 million barrels per day per year.

4. The logical conclusion from the above is that, at best, Canada's tar sands could delay peak oil by about 6.5 years if production elsewhere did not actually decline, but merely plateaued.

5. If we assume a 3% decline rate for conventional production post peak as seems more realistic than a permanent plateau, that means tar sands can only delay the peak by 2 to 3 years.

6. But it would realistically take far longer than 2 or even 6.5 years to fully develop the resource.

7. Tar sands can thus at best slow the decline but can not reverse it.

8. A recent change to tax arrangements in Alberta has, according to some reports, made oil sands unprofitable at present prices. I'm not certain as to the details but if that's true then $90 is going to look cheap real soon as oil sands development grinds to a halt until prices rise to make it profitable again.

Venezuela.

The natural bitumen in Venezuela represents a bit under a decade's worth of global oil supply at present global production rates. But being heavy oil, it would take far longer than that to extract it.

Also, there are essentially no refineries in the world able to process the oil unless it is upgraded first.

But upgrade the oil and the volume goes down.

Overall, it's another thing that can help but can't actually reverse the situation on a long term basis.

But due to political problems, Venezuela's resources are effectively of very limited use to the Western world under present conditions. Only if there's a political revolution in Venezuela does it become worthwhile even thinking about their resources being available. At present, the stuff might as well not be there at all.

As for all the other unconventional "oil" sources, they were going to be economic at $40 per barrel. Then it was $50. Then it was $60. Then it was $80. Now it's $100 and still rising.

The reason is simple. The higher the cost of crude oil, the higher the cost of energy to make the alternatives work given their low EROEI.

It's like saying that robots will be cheaper than humans if wages double whilst failing to mention that a doubling of wages also greatly increases the cost of building the robots. End result is wages need to go up probably 10 fold before the robots actually make financial sense.

Much the same with all these energy-intensive oil substitutes. They'll work but you need to factor in using the energy produced as the basis for the financial cost of energy used for the project itself rather than basing the calculations on today's cheaper energy. Trouble is, do that and the results are rather frightening. But also rather accurate.

Oil we will have. But not at a price that gives a normal person reason to query any performance aspect of their vehicle other than fuel consumption and how to minimise it.:2twocents
 
thats correct energy prices will increase my point is that this increase can be offset with efficiency gains and new technology. A cheap car will be expensive to run and an expensive car will be cheap to run. Also public transport can improve greatly and fact is by 2020 we will be ready to start implimenting a hdrogen fuel economy. Right now there are many many been looked into hydrogen production without using huge amounts of electricity. One for example is an algae that uses photosynthesis to produce hydrogen. My point is peak oil is not going to be a problem because there is a solution and as you say we can use these alternatives to give us breathing room in between.
 
Dhukka no offence mate but that garbage about housing causing recessions in the past is BS! housing alone has only ever caused one recession and that was the japanese recession that was caused by the housing bubble burst.

It is a consequence of a recession that housing activity like all economic activity in the country effected goes down.

Panic of 1819 (1819 - 1824), the first major financial crisis in the United States.
Panic of 1837 (1837 - 1843), a sharp downturn in the American economy caused by bank failures and lack of confidence in the paper currency
Panic of 1857 (1857 - 1860), failure of the Ohio Life Insurance and Trust Co. bursts a European speculative bubble in U.S. railroads and loss of confidence in U.S. banks
Panic of 1873 (1873 - 1879), economic problems in Europe prompt the failure of Jay Cooke & Company, the largest bank in the U.S., bursting the post-Civil War speculative bubble
Long Depression (1873 - 1896), begins with the collapse of the Vienna Stock Exchange and spreads throughout the world. Some historians do not believe it is actually one large recession. It is important to note that during this period the global industrial production greatly increased. In the US for example, industrial output increased 4 times.
Panic of 1893 (1893 - 1896), failure of the U.S. Reading Railroad and withdrawal of European investment leads to a stock market and banking collapse
Panic of 1907 (1907 - 1908), begins with a run on Knickerbocker Trust Company stock October 22nd 1907 sets events in motion that will lead to a depression in the United States.
Post-WWI recession - marked by severe hyperinflation in Europe over production in North America. Very sharp, but also brief.
Great Depression (1929 to late 1930s), stock market crash, banking collapse in the United States sparks a global downturn, including a second but not heavy downturn in the U.S., the Recession of 1937.
Post-Korean War Recession (1953 - 1954) - The Recession of 1953 was a demand-driven recession due to poor government policies and high interest rates.
1973 oil crisis - a quadrupling of oil prices by OPEC coupled with high government spending due to the Vietnam War leads to stagflation in the United States.
1979 energy crisis - 1979 until 1980, the Iranian Revolution sharply increases the price of oil
Early 1980s recession - 1982 and 1983, caused by tight monetary policy in the U.S. to control inflation and sharp correction to overproduction of the previous decade which had been masked by inflation
Great Commodities Depression - 1980 to 2000, general recession in commodity prices
Late 1980s recession - 1988 to 1992, collapse of junk bonds and a sharp stock crash in the United States leads to a recession in much of the West
Japanese recession - 1991 to present, collapse of a real estate bubble and more fundamental problems halts Japan's once astronomical growth
Asian financial crisis - 1997, a collapse of the Thai currency inflicts damage on many of the economies of Asia
Early 2000s recession - 2001 to 2003: the collapse of the Dot Com Bubble, September 11th attacks and accounting scandals contribute to a relatively mild contraction in the North American economy.
 
sorry but one thing to note is that the only recession ever caused by a housing bubble has been going for over 20 years :eek:

right now OZ, england, europe and the US have housing bubbles :confused:

That said though there are other factors effecting the japanese recession such as the fact that they are a tiny island and probably find rapid development very hard now
 
Dhukka no offence mate but that garbage about housing causing recessions in the past is BS! housing alone has only ever caused one recession and that was the japanese recession that was caused by the housing bubble burst.

It is a consequence of a recession that housing activity like all economic activity in the country effected goes down.

Panic of 1819 (1819 - 1824), the first major financial crisis in the United States.
Panic of 1837 (1837 - 1843), a sharp downturn in the American economy caused by bank failures and lack of confidence in the paper currency
Panic of 1857 (1857 - 1860), failure of the Ohio Life Insurance and Trust Co. bursts a European speculative bubble in U.S. railroads and loss of confidence in U.S. banks
Panic of 1873 (1873 - 1879), economic problems in Europe prompt the failure of Jay Cooke & Company, the largest bank in the U.S., bursting the post-Civil War speculative bubble
Long Depression (1873 - 1896), begins with the collapse of the Vienna Stock Exchange and spreads throughout the world. Some historians do not believe it is actually one large recession. It is important to note that during this period the global industrial production greatly increased. In the US for example, industrial output increased 4 times.
Panic of 1893 (1893 - 1896), failure of the U.S. Reading Railroad and withdrawal of European investment leads to a stock market and banking collapse
Panic of 1907 (1907 - 1908), begins with a run on Knickerbocker Trust Company stock October 22nd 1907 sets events in motion that will lead to a depression in the United States.
Post-WWI recession - marked by severe hyperinflation in Europe over production in North America. Very sharp, but also brief.
Great Depression (1929 to late 1930s), stock market crash, banking collapse in the United States sparks a global downturn, including a second but not heavy downturn in the U.S., the Recession of 1937.
Post-Korean War Recession (1953 - 1954) - The Recession of 1953 was a demand-driven recession due to poor government policies and high interest rates.
1973 oil crisis - a quadrupling of oil prices by OPEC coupled with high government spending due to the Vietnam War leads to stagflation in the United States.
1979 energy crisis - 1979 until 1980, the Iranian Revolution sharply increases the price of oil
Early 1980s recession - 1982 and 1983, caused by tight monetary policy in the U.S. to control inflation and sharp correction to overproduction of the previous decade which had been masked by inflation
Great Commodities Depression - 1980 to 2000, general recession in commodity prices
Late 1980s recession - 1988 to 1992, collapse of junk bonds and a sharp stock crash in the United States leads to a recession in much of the West
Japanese recession - 1991 to present, collapse of a real estate bubble and more fundamental problems halts Japan's once astronomical growth
Asian financial crisis - 1997, a collapse of the Thai currency inflicts damage on many of the economies of Asia
Early 2000s recession - 2001 to 2003: the collapse of the Dot Com Bubble, September 11th attacks and accounting scandals contribute to a relatively mild contraction in the North American economy.

Kiwi,

Did you actually read my post? I am NOT claiming that Housing downturns cause recessions. However Housing downturns do lead recessions, that doesn't mean they cause them, but they are a good indicator of coming recessions.
 
Kiwi,

Did you actually read my post? I am NOT claiming that Housing downturns cause recessions. However Housing downturns do lead recessions, that doesn't mean they cause them, but they are a good indicator of coming recessions.

Also, economists like to give a single "cause" for a particular recession, so they can label it and pigeon-hole it to suit their favourite economic theory.

However these "causes" may be nothing more than another symptom. I reckon, you could trace it all back to the expansion and contraction of credit, in most cases. The expansion of credit and inevitable malinvestment that follows will just manifest itself in different ways.

Credit contraction inevitably follows, but may just need a "catalyst" to tip it over the edge. But the root of any recession is still a credit bubble.

:2twocents
 
Overseas property markets are looking absolutely dreadful... and it has only just started.

Over the next 3-5 years a lot of things may or may not play out.

*Credit crunch phase II leading to a longer term contraction in credit.
*Recession
*Peak Oil (which will severely affect car dependent suburbia)

We have just completed a massive credit expansion/real estate/building bubble which may be in for a hard landing.

IMO there is a way to go before this downside plays out.

****with all the usual disclaimers, etc.
Hello,

maybe 1yr, 5yr or never to occur

credit crunch phase I came and went, its like people have an eternal flame for total destruction

why are people so jaded about current situation, please explain

thankyou

robots
 
credit crunch phase I came and went,
No it didn't. It's still very much in play, there is just very little in the news about it. Talk to the credit market boys and poo is still flying off the propeller blades.

The public are just being treat like mushrooms.
 
Nailplates are the little things that hold timber together for roof, floor and wall structures. Sales have dropped 70% in Florida over the last 12 months.

I really [sincerely] feel sorry for all those magazine journalists that write for the property magazines that could loose their jobs. I was just in the news agent and there must be almost half a shelf full of them. I didn't check if they were offering discounts on five and ten year subscriptions.
 
I really [sincerely] feel sorry for all those magazine journalists that write for the property magazines that could loose their jobs. I was just in the news agent and there must be almost half a shelf full of them. I didn't check if they were offering discounts on five and ten year subscriptions.

hello,

the story so far

thankyou

robots
 
Also, economists like to give a single "cause" for a particular recession, so they can label it and pigeon-hole it to suit their favourite economic theory.

However these "causes" may be nothing more than another symptom. I reckon, you could trace it all back to the expansion and contraction of credit, in most cases. The expansion of credit and inevitable malinvestment that follows will just manifest itself in different ways.

Credit contraction inevitably follows, but may just need a "catalyst" to tip it over the edge. But the root of any recession is still a credit bubble.

:2twocents

Absolutely, this time around subprime will probably get the blame. However subprime is just a symptom of a much bigger problem, which as you alluded to was the proliferation of cheap and easy credit.
 
[h=1]Housing Starts Up 28.5% Annually[/h]Sophia Fain 9:26AM, June 19, 2012

Housing starts in May dropped 4.8% from April to a seasonally adjusted annual rate of 708,000. However, compared to May 2011, housing starts are up 28.5% for the month. Single-family housing starts in May gained 3.2% month-over-month to a rate of 516,000. The multi-family component dropped 24.2% m-o-m to a rate of 179,000.
Housing permits in May increased 7.9% from April to a seasonally adjusted annual rate of 780,000, up 25% from May 2011. The single-family permits gained 4% from the prior month at a rate of 494,000 along with authorizations of units in buildings with five units or more gaining 17.7% at a rate of 266,000 in May.
Housing completions in May were at an annual pace of 598,000, down 10.3% from April but 10.1% from May 2011. The single-family component dropped 6.3% in housing completions at a rate of 458,000. The multi-family component dropped 25.7% from April to a rate of 130,000 for housing completions in May.

Source: U.S. Census Bureau and the Department of Housing and Urban Development


Completely agree! The US Economy may not be flying, but it is still growing by between 1-1.5% GDP.

Again, as economists we need to look at the economic indicators as we continue to invest in the ASX.

-----------------------------------------------------------------------------------------------------------
I Hold: IndoChine Mining {ASX:IDC}


Markets are still weak on the back of the EU summit which will be held this Thursday and Friday.

Our future lies with China, in terms of our mineral prices and US in terms of stock market money flows. The EU will come out of this situation.

What is very interesting is the fact that US new home sales increase in May at the fastest pace in 2 years. This means Operation Twist1 which was activated in September 2011 worked exactly as Mr Bernanke had hoped. Bringing long term bond prices down by purchasing 30 year bonds, which is what 90%+ of US mortgages are lent against. These lower interest rates allowed home owners to renegotiate current loans into lower interest rate loans, giving them more disposable income to pay down credit cards, buy goods and service, and now also allow new home owners to buy a new house at almost approximately 3-4% interest.

Housing construction is the largest service employer, plumbers, chippies, electricians, truck drivers, rely on new housing construction for work. In every recession this has been the sector to lift any Western Economy out of recession, this has been missing on a consistent basis in the US since the GFC. The figures for May show a strong turnaround, on top of that we have another $267Billion Operation Twist II which was just activated last week, which will stimulate the US economy's largest service employer into the second half of 2012 onwards.

Not only will this lead to stronger employment, but also stronger demand for construction materials to build these homes.

As monthly statistics begin to roll out that the world isnt falling into recession, coupled with govt and central bank action which is set to accelerate into 2012, we will see a rebound of current oversold levels in the ASX.

http://www.bloomberg.com/news/2012-...in-u-s-increased-to-two-year-high-in-may.html


Home Sales Reach Two-Year High as U.S. Rates Fall: Economy
By Lorraine Woellert - Jun 26, 2012 6:33 AM ET
• Facebook Share

• LinkedIn
• Google +1
• 44 Comments

• Print
• QUEUE
Q

Daniel Acker/Bloomberg
New home construction in Elgin, Illinois.
Demand for new U.S. homes rose more than forecast in May as mortgage rates dropped, bolstering the residential real-estate market while other parts of the world’s largest economy cool.


Play Video
June 25 (Bloomberg) -- Demand for new U.S. homes rose more than forecast in May as mortgage rates dropped, bolstering the residential real-estate market while other parts of the world’s largest economy cool. Erik Schatzker reports on Bloomberg Television's "Market Makers." (Source: Bloomberg)
Enlarge image
The deck of a Toll Brothers Inc. model home stands in Randolph, New Jersey. Falling borrowing costs and more affordable properties may keep luring buyers, even as a cooling job market and limited access to credit restrain the recovery. Photographer: Emile Wamsteker/Bloomberg
Sponsored Links
Buy a link

Purchases climbed to a 369,000 annual rate, the most since April 2010 and up 7.6 percent from the prior month, the Commerce Department reported today in Washington. The median estimate in a Bloomberg News survey of 67 economists was 347,000. The number of houses on the market held near a record low.
Falling borrowing costs may keep luring buyers to builders like Toll Brothers Inc. (TOL), even as a cooling job market and limited access to credit restrain the recovery. The Federal Reserve last week extended a program to keep long-term interest rates low in a bid to reduce unemployment, sustain housing and prevent a global slowdown from stalling the expansion.
“It’s another sign of life in the housing sector,” said Brian Jones, a senior U.S. economist for Societe Generale SA in New York, who forecast a gain to 362,000. “It’s consistent with a gradual improvement in activity, but we’ve got miles to go before we get back to normal.”
Stocks dropped amid concern that a meeting of European leaders later this week will fail to help contain the region’s debt crisis. The Standard & Poor’s 500 Index dropped 1.6 percent to 1,313.72 at the 4 p.m. close in New York. The yield on the benchmark 10-year Treasury note fell to 1.60 percent from 1.68 percent late on June 22.
BIS Report
Elsewhere, the Basel, Switzerland-based Bank for International Settlements said in its annual report published yesterday that central banks in developed nations are confronting the limits of their ability to aid economic recovery as government efforts to strengthen finances fall short.
Bloomberg survey estimates for U.S. new-home sales, which are counted when contracts are signed, ranged from 327,000 to 375,000. The April reading was unrevised at the previously estimated 343,000, while March and February were revised up.
The median sales price increased 5.6 percent from the same month last year, to $234,500, today’s report showed. Prices have climbed on a 12-month basis since February, the best performance in five years.
Purchases rose in two of four U.S. regions last month, led by a 37 percent jump in the Northeast, while the South climbed 13 percent. Demand dropped 11 percent in the Midwest and 3.5 percent in the West.
Lean Supply
The number of newly constructed houses on the market was at 145,000 compared with the record low of 144,000 reached in April and March. The record high of 572,000 was reached in July 2006. The supply of new houses on the market at the current sales pace dropped to 4.7 months, the lowest since October 2005, from 5 months in April.
In response to improving demand, builders broke ground on 516,000 single-family houses last month at an annual pace, up 3.2 percent from April and the most this year, the Commerce Department reported last week.
The Washington-based National Association of Home Builders/Wells Fargo sentiment index rose by 1 point this month to 29, the highest since May 2007, another report last week showed.
Horsham, Pennsylvania-based Toll Brothers, the largest U.S. luxury-home builder, on May 23 reported second-quarter profit that beat estimates as orders jumped.
Suppliers Benefit
United Technologies Corp. (UTX) and Lennox International Inc. (LII), makers of heating and air conditioning units, are among companies benefitting from developers’ positive outlook. Lennox, based in Richardson, Texas, had a 40 percent increase in sales to new-home builders in the first quarter. United Technologies, in Hartford, Connecticut, forecasts about 700,000 housing starts this year, Chief Financial Officer Gregory Hayes said.
“The expectation is we’re not going to see a huge recovery in the U.S. residential marketplace, but we should see a steady recovery,” Hayes said at a June 14 conference. “Residential is coming back, but it’s very, very slow.”
The stabilization in housing has boosted builder shares this year. The Standard & Poor’s Supercomposite Homebuilder Index has climbed 33 percent this year through June 22, compared with a 6.2 percent gain for the broader S&P 500.
Residential construction hasn’t contributed to economic growth over the course of an entire year since 2005, when it accounted for 0.4 percentage point of the 3.1 percent increase in gross domestic product. From 2006 through 2009, the homebuilding slump subtracted 0.8 percent point from growth on average. The declines diminished over the past two years.
Shrinking Share
Newly constructed houses made up 6.7 percent of the residential market last year, down from a high of 15 percent during the boom of the past decade.
Sales of existing homes declined in May as fewer distressed properties reached the market, the National Association of Realtors reported last week. The decline in transactions involving foreclosures and short sales, where a lender agrees to accept less than the balance of the mortgage, helped push the median price of a previously owned house up 7.9 percent from the same time last year, the biggest 12-month gain since February 2006.
Less competition from existing houses and even lower mortgage rates may keep spurring the market. The average rate on a 30-year fixed loan dropped to 3.66 percent last week, the lowest in data going back to 1972, according to Freddie Mac.
The central bank last week aimed to keep borrowing costs low. Policy makers announced they will expand the Operation Twist program to extend the maturities of assets on its balance sheet. They said they stood ready to take further action to put unemployed Americans back to work. Fed officials also lowered their outlook for growth and employment.
To contact the reporter on this story: Lorraine Woellert in Washington at lwoellert@bloomberg.net
 
I resurrected this thread for two reasons.
(1) It is interesting to read what posters (most long gone) had to say on the subject 15 years ago.
(2) It was the closest Thread heading to what i was going to comment on without creating another thread

The USA housing market is a little different to that of OZ in a few areas, but one of the areas that creates a whole new set of problems/advantages is that many of the US cits buy a house with a fixed 30 year mortgage.
So If you bought a house in 2020 when there were effectively negative rates from the Fed Reserve, you could lock in a 30 year mortgage at 3%.
From Zero Hedge

Who's left to buy overvalued houses? Too few to prop up bubble valuations

If as many posit the Federal Reserve has an unstated mandate to generate a "wealth effect" by propping up housing, they've managed to create a no-win situation. As longtime correspondent K.M. recently documented, roughly half of the 50+ million home mortgages in the US were refinanced in 2020 and 2021 to lock in historically low interest rates of less than 4%, with many around 3%.


Closed-end originations (excluding reverse mortgages) increased in 2020 by 65.2 percent, from 8.3 million in 2019 to 13.6 million in 2020.

Almost 25% of homeowners refinanced in 2021.

About half (51%) of homeowners have a rate under 4%.

As K.M. observed:

"That doesn't include the millions who bought houses 2020 - 2021 at rates below 4%, who similarly are unlikely to sell unless rates drop well below 5%. Those who got rates below 3% or thereabouts, may be permanently off the market.
Think about it - why would I sell and surrender a 2.75%, 3.00% or 3.25% 30-year mortgage, only to move into another house with a loan at 5.5% - 6.5%? I'm locked into my house and loan for years if not decades.
And then there are reverse mortgages, which essentially lock the elderly in their houses for life. That's been a housing stock reduction force for years now and may explain the increase in the number of houses in obvious disrepair.
I think you can see where I'm going with this. The artificially low rates of 2020 - 2021 have at least semi-permanently (and permanently in millions of cases) removed many millions of housing units from the market."

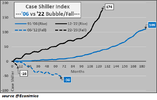
We all know what happened to housing valuations as mortgage rates plummeted and post-pandemic panic-buying swept through the market: valuations skyrocketed, pushing housing affordability to near-record lows. (See chart below of the Case-Shiller Index which shot up from below 100 to 174 in the 2020-2022 bubble mania.)

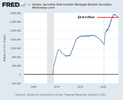
This was not "market forces"--this was outright intervention by the Federal Reserve and federal housing agencies. As the chart below of mortgage-backed securities (MBS) held by Federal Reserve banks shows, the Fed went from owning zero MBS prior to the bursting of the first housing bubble in 2007-08 to owning roughly 20% ($2.6 trillion) of the entire US mortgage market for conventional single-family homes: ($13 trillion).

Fed-MBS4-23a.png
Federal agencies such as the Federal Housing Administration (FHA) and Veterans Administration (VA) offer low-down payment mortgages and other incentives. The mortgage-backed securities are guaranteed by Fannie Mae, Freddie Mac, or Ginnie Mae, quasi-governmental agencies. The entire state-central-bank financial machinery has worked together to inflate a housing bubble that makes those who bought long ago feel wealthy while making housing unaffordable to younger buyers who don't have the luxury of getting help from wealthy parents.

So the Fed has succeeded in inflating a housing bubble that makes the already-wealthy feel even wealthier, but only by throwing the younger generations of potential homeowners under the bus. As I have argued here, (Why Interest Rates Are Not Going Back to Zero), the risk profile of the global economy and financial system has changed, and this risk is repricing the cost of capital (interest rates) and all financial assets.

housing-bubble-CH4-23a_0.png

K.M. summed it up thusly:

"The whole problem with housing in the past several decades has been the manipulation of the market by government players - The Fed, HUD, FNMA/FHLMC, and the other alphabet-soup agencies that rule the housing market. It has far less to do with natural demand and supply than is commonly believed. I'm saying this as one who worked in the mortgage business for many years."
Unless the Fed is going to buy up the entire $13 trillion mortgage market, market forces will keep mortgages rates in the historical range of 5% to 7%.

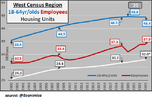
Meanwhile, those with 3% mortgages are trapped in their current homes which are effectively off the market, and would-be young homeowners face the unaffordable combination of bubble-valuations and high mortgages rates. As I concluded in my previous commentary on the housing bubble (This Housing Bubble Is Different: It's Much More Precarious), Distortions eventually have consequences. Concentrate wealth and income in the top 5% and corporations, and give the already-wealthy abundant low-cost credit to concentrate ownership of assets, and you get a distorted economy in which the older and wealthier have outpriced the young.

Who's left to buy overvalued houses? Too few to prop up bubble valuations.

CH-housing4-23a_0.png

This Fed-engineered generational wealth-opportunity inequality will generate more than a phantom "wealth effect"--it will also generate second-order effects of social fragmentation and the erosion of the social contract that the Fed is powerless to repair.
Once again it shows that those unfortunate "unintended consequences" will pop up and ruin the best laid plans of mice and men.
Mick
 
Maybe we should be talking about commercial real estate instead?

well there is plenty of debt out there and most of that debt was taken out on assumptions that have changed like probable vacancy rates , interest payments ( i doubt many would have allowed for 100% interest rate increases ) and of course the extra difficulty when refinancing is needed , and there will be unevenness across the sector office space and some retail space could be negatively impacted , while maybe 'warehouse space could be in for a tailwind
 
Top