Australian (ASX) Stock Market Forum

Greynomad99 Weekly ASX review

Joined
19 August 2021
Posts
249
Reactions
736
Some of you will know me as I'm a recent refugee from the Commsec users forum that closed recently. I publish a brief overview of the market from a charting perspective each week, including details of stocks I've traded and stocks that I think could be going places. Charts and a brief analysis of mentioned stocks are also linked. A number of Commsec users used to find my comments of interest but I understand that won't apply to everyone. For those who want to catch my ramblings they can be found here: https://sharecharting.com.au/blog-example
 
@Greynomad99 Welcome to ASF. As you've seen we've got almost all types of traders and investors here. We leave the gamblers to the "other" forum.

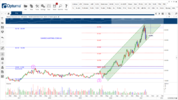
Seeing your KGN chart I'm interested in your opinions on sloping resistance lines vs horizontal resistance lines. They seem to be an important part of your chart analysis.

Do you put more weight on one over the other?
Do you use one as a warning or alert and one as confirmation?
Please post comments about how you use the lines in your analysis.

I use them in many of my charts as a guide that simplifies the selection and decision process.
Hi - its pretty hard to provide a simple answer to this - other than to say that all charting theories contribute to an overall decision re the probability of a future outcome.
1. The most important indicator to me is Elliott Wave - ie are we in a part of the price cycle where prices generally rise or are we in the latter part where they fall. EW also indicates where cycles might end - ie bottoms.
2. Trend comes next - I look for a techncial uptrend 12 weeks of higher prices ideally making higher weekly troughs followed by higher peaks.
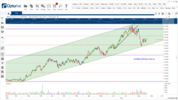
3. The evenly spaced red horizontal lines indicate levels of support and resistance (drawn using a price extension tool by eye). These give me an idea of where price might turn.
If I see a pattern - flag, pennant, Wyckoff or a resistance break then they are the strongest indicator of a reliable move one way or the other. Resistance breaks are my favourite but like all things in charting it isn't every break that works - they need to fulfil certain criteria.
To answer your queries in detail I'd need to write a book I'm afraid (and yes, I've done that to)
 
@Greynomad99 Welcome to ASF. As you've seen we've got almost all types of traders and investors here. We leave the gamblers to the "other" forum.

Seeing your KGN chart I'm interested in your opinions on sloping resistance lines vs horizontal resistance lines. They seem to be an important part of your chart analysis.

Do you put more weight on one over the other?
Do you use one as a warning or alert and one as confirmation?
Please post comments about how you use the lines in your analysis.

I use them in many of my charts as a guide that simplifies the selection and decision process.
I overlooked noting that where you can fit a line beneath price lows over several years, that is a strong level of support unlikely to be breached. Same applies to peaks and often those two lines will be parallel making a price channel. I am a great fan of using price channel to identify where price may turn.
 
Hi GN & peter2,
May as well throw my thoughts into this discussion - I assume you are referring to something like the snapshot below.
Many more TA examples are shown in the Beginners Lounge forum "DrBourse TA Help for Beginners".
 

Attachments

  • Page 035 Sup Res Lines 2.JPG
    Page 035 Sup Res Lines 2.JPG
    135.8 KB · Views: 28
Hi GN & peter2,
May as well throw my thoughts into this discussion - I assume you are referring to something like the snapshot below.
Many more TA examples are shown in the Beginners Lounge forum "DrBourse TA Help for Beginners".
Hi Dr B - Not sure what system P2 uses but may llok it up. For me I use candles but only for confirmation usually. Candles are great for day traders but I only think they are really relaible over short periods of time and less help to medium/long term trades.
 
Hi Dr B - Not sure what system P2 uses but may llok it up. For me I use candles but only for confirmation usually. Candles are great for day traders but I only think they are really relaible over short periods of time and less help to medium/long term trades.
Aww GN, thought I had trained you in all aspects of Candlesticks, once you get the hang of it they work well for anything from Tick Trading to Long Term Trading - Back to the Training room for you M8. ;)
 
I've studied candles at length both in the course I did years ago and the book (Nison). Don't get me wrong, they work but best over a short time frame in my opinion. I mainly use them for reversal warnings.
 
sorry $40 ( ish ) won't get me excited for MIN

closer to $13 will get me interested in adding more ( about the same price i was paying in 2019 )

cheers
 
including MIN which might have the potential for a 30% gain.

Greynomad99 Weekly ASX review


I love the subjectivity of T/A I could be the devils advocate for a 30% reversal.
Correct Risk and trade management can avoid damage OR capture gain.
Well I wouldn't disagree with that and you said the magic word about T/A - it is extremely subjective. What's the saying? - "Beauty is in the eye of the beholder". That sums it up pretty world. For clarity I'm not saying MIN will rise 30% - only that it might. There are a number of things that say it could - sustained growth for 18 months and stock remains in a technical 12 week uptrend (theory says it is more likely to keep rising than falling). Price above trend and within a price channel is positive and the recent/current reversal could have been expected once price reached the top of said price channel (it was also exactly the target of a resistance break target off $50). Price fell exactly to a level of support/resistance and reversed. One the negative side, price has made lower weekly troughs followed by lower weekly peaks - a sell signal. Elliott Wave says that Wave 4's (a falling wave) usually start at about 261.8% (a Fibonacci number) of the rise of Wave 1 measured up from the end of Wave 1. On the chart you can see that the current decline starts at that 261.8% level - so it is probably a W4. W4 and W2 usually unfold with alternate formats - if W2 is a falling seesaw sideways pattern that drifts slowly lower, then W4's fall will usually be a steeper dramatic fall - and vice versa. MIN's W2 and W4 (assuming it is W4) conform to this theory.
None of this really tells me whether the current bounce off resistance marks the start of a recovery or is just the famous Dead Cat bounce.
Do I hold MIN? No. Am I thinking about buying? Yes - but not yet.
If you look at the daily chart, price has hit overhead resistance at $55.54 and it has failed to break higher after 3 attempts in 7 trading sessions and the lower volume over the past 3 days suggests conviction for a move higher is waning (but I'm always cautious of daily charts). Friday's candle was a reversal pattern so I'd expect lower prices Monday. Price could go anywhere from here in the short term. It isn't unusual for prices to retest previous support and thats about $50.70 in MIN's case. The question is what happens then? A retest followed by a break higher is a strong sign price will then resume a good rise - or it can just fall away lower out of the price channel on a longer Wave 4 fall.
Of course the trader's dilema is to wait and see if price retests etc and price is in a recovery and continues to rise away, then they are missing potential profit by not being in the trade. If they buy now on potential and it all turns to custard they will lose money. Damned if you do and damned if you don't.
If price goes above $55.60 this coming week it will have made a couple of higher peaks followed by higher daily troughs which is encouraging and importantly if it closes above $55.60 I might chance a buy at that point as it will have broken above resistance.
No easy answer here - if there was we'd all be driving around in Rollers!

1630793465314.png

1630793503390.png
 
GN
Nothing wrong with your analysis. Like your work.

The trick to technical trading in my view is to be able to
observe a reason to buy or sell and put in place the best
trade and risk management to gain as much profit as you can.

So in the MIN example you could trade either way short or long
depending on perspective.

For me a long trade was at the Chanel and reversal --a late long trade would be the break of the current
3 short term highs with an obvious stop.
Short would be a break of the current 2 lows with a half position and a full position on the break of the
Current lowest low. Stops could be the break of the highs.

I like to keep analysis simple without dragging in a number of various Technical tools.
Current bias is Short.

Just adding discussion.
Agree with all that. I don't normally get into all the T/A mumbo jumbo but as you say, a share like MIN can go either way and sometimes people read a short comment suggesting it could rise if A,B and C happen as meaning you can put the house on it. If I'm responding to someone who understands T/A then (as with my earlier comment) I might spell out my reasoning on the basis it may be helpful to others (as it is for me when others share their analysis).
As for MIN I'd say we're on the same page.
 
Another week and another drubbing. My blog this week comments on the similarity todays chart of the XAO has with that 12 months before the GFC. No, I'm not saying I'm expecting another melt down like the GFC but our market is currently at the crossroads. Anyway, some may find my musings of interest and anyone not trading back in 2007 could do well to take notice. Remember - history repeats!
 
My thoughts for this week (17 September 2021) can be ofund here: https://sharecharting.com.au/blog-example
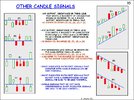
Apart from the odd speculative trade there isn't a lot of positive vibes around the market - although in the immediate short term there are a couple of hints in the charts that next week might be an up week - but in a downtrending market.
Good luck to all.
 
Another week, another blog for those interested - https://sharecharting.com.au/blog-example
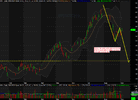
This week I did a quick scan of the ASX 300 and found only 1 stock that met the buy criteria I suggest to anyone who wants to dabble in the stock market but doesn't have a lot of experience or skill.

While opportunities still present there isn't much about the market's charts that get me exited at the moment.

Good luck to everyone for ther coming week - hopefully it isn't another 3 steps forward and 4 backwards!
 
Top