Australian (ASX) Stock Market Forum

Economic implications of a SARS/Coronavirus outbreak

Tourism and entertainment wont be the only ones feeling the pinch, due to covid. It will be hitting other sectors too.

From the article:
Victorian Premier Daniel Andrews has responded to calls from leading surgeons to overturn a temporary ban on elective procedures.
Victorians waiting for elective surgeries will need to hold on longer, despite calls from surgeons to get them back into the operating theatre.
Following public pleas from surgeons to repeal the “blanket ban” on elective surgeries, calling it a “blunt tool” that was leaving people in long-term pain, Victorian Premier Daniel Andrews said there was more to consider than the request of a few.
Let's stop blaming Covid for that..
These are engineered hardships and shortages
 
3245637375635673567.jpg

Apparently there was a record inflow into SOXL in the last session, take that for whatever you think it's worth.

All eyes are now on earnings, it's another battle of earnings vs p/e.
 
245624562451425573.jpg

Earnings growth is winning the earnings vs inflation battle for now. Futures all screaming on the news. Lots more chop to come I expect.
 
Last edited:
is that earnings growth from a low base , or earnings propped up by stimulus/hardship packages

or maybe the inflation rate left out a few little rises

DYOR
 
is that earnings growth from a low base , or earnings propped up by stimulus/hardship packages

or maybe the inflation rate left out a few little rises

DYOR
All of the above. If you look at other indicators things aren't so great.
 
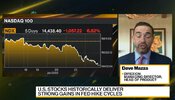
Big drop in bonds, hard run in stonks (especially tech) for the whole session and particularly into the close, NDX up ~3.1% for the day, very encouraging sign.

Eyes on crypto this weekend.
 
Last edited:
Jobs report in, is awful, futures flipped from +0.6 to -0.6, more no **** sherlock analysis:

23456262624562456425624565.jpg

As I keep saying, we've had our inflation, now here's your stagnation.

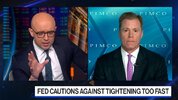
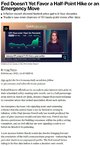
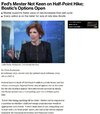
Hence why we now get statements from the fed like this:

134513456134623456123456.jpg

If that doesn't tell you firstly that A: they're absolutely bricking it and B: they're going to err on the side of hot inflation than high unemployment, nothing will.
 
During the early stages of the pandemic there calls for the Feds to put more into Job keeper, then afterwards the calls to publish the names of all those who got it.
For charities, NGOs, and the larger public companies, the data would be published in their annual accounts, so everyone could see who got what.
In some quarters, there was a legislative push to force the ATO to provide the names of all the non public and NGO orgs that got the Job keeper allowance as well.
Robert Gotliebson in Todays Australian , in writing how that legislation was thwarted, by the ATO prviding to the parliament the data required but with all identifying data redacted, provides some interesting stats on who got what.

The “de-identified data” revealed that only 14,439 small business entities received JobKeeper which represented just 1.4 per cent of the more than one million entities who applied for it. But then came the amazing statistic – those 14,439 enterprises employed 1,348,324 Australians which represented 33 per cent of the individuals who benefited from JobKeeper payments.

That particular subset of citizens are most unlikely to be in the upper levels of income receipt, indeed more than likely be in the bottom quartile.
People will draw different conclusions to the above, depending on where they sit on the political spectrum.
Mick
 
1324512345623562456245624562456.jpg

Largest miss in history, however, the unemployment RATE has actually increased.

So, we've seen a huge uptick in the participation rate.


Inflation numbers out next week, all bets are now obviously off for that and we'll probably now see it way higher than expected/forecast. Markets are already pricing this in as bond yields have spiked on this news, as will energy etc tonight. Even more talk about a 50 basis point rise at the next fed meeting now.

Even wages grew 0.7% vs a 0.5% estimated.
 
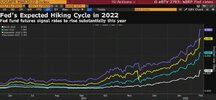
Oh and my gut instinct reference a 50 basis point rise:

Won't happen. It'll spook markets too much for the fed's appetite. We'll see the expected 25 point rise unless there's a big narrative emerge about them being asleep at the wheel or whatever.

(pure guesswork here, don't take out any positions based on this)
 
View attachment 137055

Largest miss in history, however, the unemployment RATE has actually increased.

So, we've seen a huge uptick in the participation rate.


Inflation numbers out next week, all bets are now obviously off for that and we'll probably now see it way higher than expected/forecast. Markets are already pricing this in as bond yields have spiked on this news, as will energy etc tonight. Even more talk about a 50 basis point rise at the next fed meeting now.

Even wages grew 0.7% vs a 0.5% estimated.
Always have to be careful about theses stats.
My old mate Chuck Casey used to say that if you took the L out of BLS, you would have a more accurate description of their work.
Like most of the Stats people around the world, the BLS is fond of seasonal adjustments, and every month is "seasonally adjusted" to account for these non underlying anomalies. In this case, seasonal adjustments took a loss of 2.8 million employed to a 467k gain.
Now thats what I call creative accounting!
From Zero Hedge
First, looking at just the December to January change we find that while the seasonally adjusted number rose by an impressive 467K, the unadjusted number collapsed, tumbling from 150.349 million to 147.525 million, a 2.8 million drop (as it tends to do every time the year shifts from December to January) meaning that the entire delta in the January number - somewhere in the 3+ million range - is due to arbitrary adjustments overlaid on top of the data.
Secondly, its the ten year "readjustment" that the BLS do to past accounts, which shows some drastic changes to figures.

The plot thickens, and indeed one thing that analysts apparently forgot when they were submitting their forecasts for January's payrolls is that this is the month when the BLS adjusts data for the past 10 years as part of its population estimates revisions, which impact both the Household and more important, Establishment, surveys.

In summary, what these revisions did was to revise 2017 job growth lower by by -61,000, 2018 lower by -26,000, 2019 revised lower by -43,000, while 2020 was revised higher by 124,000, and 2021 was also revised up 217,000, or in total a 211,000 upward revision over 5 years or 3,500 jobs per month.

Focusing on just 2021, we find something curious: the stunning print from the summer which saw June and July print at or over 1 million, have been slashed by almost 50%, at the expense of most recent months such that October added 29K, November added 398K and December added 311K jobs to what was the original print only as a result of seasonal adjustments. Said otherwise, March-July was revised lower by -1,061,000 while Aug-Dec was revised up by +817,000.
There may well be valid reasons for these "adjustments", but whether valid or not, it displays just how little faith one can put in these stats.
Mick
 
Always have to be careful about theses stats.
My old mate Chuck Casey used to say that if you took the L out of BLS, you would have a more accurate description of their work.
Like most of the Stats people around the world, the BLS is fond of seasonal adjustments, and every month is "seasonally adjusted" to account for these non underlying anomalies. In this case, seasonal adjustments took a loss of 2.8 million employed to a 467k gain.
Now thats what I call creative accounting!
From Zero Hedge

Secondly, its the ten year "readjustment" that the BLS do to past accounts, which shows some drastic changes to figures.


There may well be valid reasons for these "adjustments", but whether valid or not, it displays just how little faith one can put in these stats.
Mick
True, we could wax lyrical about this for days, but, perception is reality in this business ;)
 
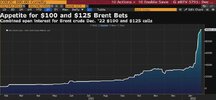
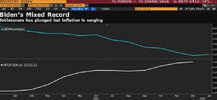
Inflation data out today, was bad, standard SNAFU, this chart really says everything for quite a while now guys:

24562456245714235624572145761425.jpg
243562456345624356243623624362.jpg

As soon as anything changes I'll let you know but I'm going to try to keep the inflation chat to the inflation thread on account of this one rapidly becoming groundhog day.
 
Oh and my gut instinct reference a 50 basis point rise:

Won't happen. It'll spook markets too much for the fed's appetite. We'll see the expected 25 point rise unless there's a big narrative emerge about them being asleep at the wheel or whatever.

(pure guesswork here, don't take out any positions based on this)
24356246432574257.jpg24624645347345737.jpg
 
Top