Australian (ASX) Stock Market Forum

Dump it Here

@Nick Radge thank you for your interest in my "PercentageUp" timing filter. I try not to talk in technical terms as this is a beginner's thread but for you, I can expand the explanation & construction of this filter.

The "PercentageUp Filter" calculates the percentage of stocks in a watchlist that have closed higher than their open price averaged over a nPeriod removing the weighting from each position in the watchlist. The code first gets the watchlist symbols & then loops through each symbol in the watchlist. For each symbol, the code sets the foreign symbol & calculates the percentage of bars where the close price is higher than the open price. The code then saves the total number of bars & the number of bars where the close price is higher than the open price to static variables.

The percentage of bars where the close price is higher than the open price is then calculated by dividing the number of bars where the close price is higher than the open price by the total number of bars & multiplying by 100. The code then sets the PercentageBullish variable to "True" if the percentage of bars where the close price is higher than the open price is greater than 50%, & sets the PercentageBearish variable to "True" if the percentage of bars where the close price is higher than the open price is less than 25.

Finally, the "PercentageUp" variable is set to "True" if the PercentageBullish variable is True. Each variable "PercentageBullish variable" & the "PercentageBearish" variable performs completely different functions within the strategy.

Simply, the "PercentageUp Filter" is constantly calculating the percentage of stocks in a watchlist that have a bullish or bearish trend based on their closing & opening prices. The "PercentageUp" code retrieves the user-defined value for the watchlist filter using the GetOption() function & assigns it to the variable. Then, it uses CategoryGetSymbols() function to retrieve a list of symbols in the watchlist specified by the categoryWatchlist argument.

Next, the code initialises variables Up, Total, & period to zero. The If statement then checks whether the Status() function returns zero for the parameters, indicating that the code is being executed for the first time. If so, the code enters a loop that iterates through each symbol in the watchlist using a "for loop".

Within the loop, the code sets the current symbol as the foreign symbol using the SetForeign() function, which prepares the AFL for working with data from that symbol. It then calculates the percentage increase in price by dividing the Close price by the Open price, & increments the Up variable if the result is greater than 1 (indicating a bullish trend). It also increments the period variable if the Close price is not null. Finally, the code restores the price arrays to their initial state using RestorePriceArrays().

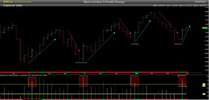
After the loop has been completed, the code saves the values of the Up & period variables to static variables using the StaticVarSet() function. Convert that to a ribbon & it's easy to understand the timing of this filter.

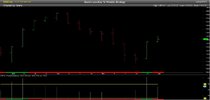
XAO time stamp (27/3/2023 @1pm)
At times a picture paints a thousand words.

View attachment 155006


View attachment 155007

Skate.

Thank you Skate for sharing in detail this very Interesting indicator, despite having spend weeks searching this forum and read your detailed reply above, there is still things that is left for interpretation.

Please correct me where I am wrong in interpreting your text..

"The "PercentageUp Filter" calculates the percentage of stocks in a watchlist that have closed higher than their open price averaged over a nPeriod removing the weighting from each position in the watchlist. The code first gets the watchlist symbols & then loops through each symbol in the watchlist. For each symbol, the code sets the foreign symbol & calculates the percentage of bars where the close price is higher than the open price. The code then saves the total number of bars & the number of bars where the close price is higher than the open price to static variables.

The percentage of bars where the close price is higher than the open price is then calculated by dividing the number of bars where the close price is higher than the open price by the total number of bars & multiplying by 100. The code then sets the PercentageBullish variable to "True" if the percentage of bars where the close price is higher than the open price is greater than 50%, & sets the PercentageBearish variable to "True" if the percentage of bars where the close price is higher than the open price is less than 25."

1: You first calculate the percentage of stocks, in a watchlist, that have closed higher then open, and then you write "averaged over a nPeriod", May i ask, what is your definition of averaged ? the close and open ? or somehow the percentage you get period 1, period 2 and 3, etc is then averaged to get a total %?

2: You then take all the bars from the symbols in the watchlist, that exist for the used nPeriod (So if 100 symbols, and nPeriod is 2 weeks, that would be 200 weekly bars), and to get the (% Bullish number ) you then "dividing the number of bars where the close price is higher than the open price by the total number of bars & multiplying by 100", Have I understood your correctly?

Somehow here you get two % values, one for point 1, and one for point 2? I am sure I am misunderstanding something here.

Grateful for a clarification,

Thank you for sharing your ideas
Hi, I've seen some discussion on the value of AI. I put a question into chatgpt and this is the code generated


// Get user-defined value for watchlist filter FilterValue = GetOption("FilterValue", 70); // Get list of symbols in watchlist WatchlistName = "My Watchlist"; CategoryGetSymbols(catWatchlist, WatchlistName); NumSymbols = CategoryGetSymbolsTotal(catWatchlist); // Initialise variables Up = 0; Total = 0; Period = 20; // Check if first time running code if (Status("firstbar") == 1) { // Loop through each symbol in watchlist for (i = 0; i < NumSymbols; i++) { Symbol = CategoryGetSymbol(catWatchlist, i); SetForeign(Symbol); // Calculate percentage of bars where close is higher than open UpBars = 0; TotalBars = 0; for (j = 0; j < BarCount; j++) { if (j < Period) continue; // skip first nPeriod bars if (C[j] > O[j]) UpBars++; TotalBars++; } UpPercent = (UpBars * 100) / TotalBars; // Set PercentageBullish and PercentageBearish variables PercentageBullish = (UpPercent > 50); PercentageBearish = (UpPercent < 25); // Increment Up and Total variables if (UpPercent > FilterValue) Up++; Total++; } // Save Up and Total variables to static variables StaticVarSet("Up", Up); StaticVarSet("Total", Total); } // Retrieve Up and Total variables from static variables Up = StaticVarGet("Up"); Total = StaticVarGet("Total"); // Calculate PercentageUp if (Total > 0) { PercentageUp = (Up * 100) / Total; } else { PercentageUp = 0; } // Create ribbon of PercentageUp Color = IIf(PercentageUp > FilterValue, colorGreen, colorRed); Plot(PercentageUp, "PercentageUp", Color, styleOwnScale|styleArea|styleNoLabel, 0, 100);


It also comments "Note: This code assumes that the watchlist filter value is stored in the user-defined variable "FilterValue" and that the watchlist name is stored in the variable "WatchlistName". You may need to modify these variables to match your specific implementation."

Not at my computer, so I have no idea whether this works. Will look later today.
 
Grateful for a clarification

@Salzburg you are correct about the general idea of the code. Let me clarify your questions:
  1. The code calculates the percentage of bars (i.e., individual time periods) where the closing price is higher than the opening price for each symbol in the watchlist. A moving average (MA) period is used to determine the percentage of bars where the close price is higher than the open price over a moving average period. So, for example, if the MA period is set to 10, the code calculates the percentage of bars where the close price is higher than the open price over the last 10 bars. This moving average is calculated separately for each symbol in the watchlist.
  2. The code loops through each symbol in the watchlist & calculates the percentage of bars where the closing price is higher than the opening price. For each symbol, the code saves the total number of bars & the number of bars where the close price is higher than the open price to static variables. Then, the code calculates the percentage of bars where the close price is higher than the open price by dividing the number of bars where the close price is higher than the open price by the total number of bars & multiplying by 100. This gives the percentage of bars where the close price is higher than the open price for each symbol in the watchlist.
So, there is only one percentage value that is calculated, & it is calculated separately for each symbol in the watchlist. The "PercentageUp Filter" is simply a Boolean variable that is set to "True" if the percentage of bars where the close price is higher than the open price for a symbol is greater than 50% & "False" otherwise.

Skate.
 
Last edited:
Let me clarify further ( "PercentageUp Filter" )
The percentage of stocks in a watchlist that has closed higher than their open price over a specified nPeriod is calculated by taking the average of the percentage of bars where the close price is higher than the open price for each stock in the watchlist over the nPeriod.

For example
If the nPeriod is set to 10, the code will calculate the percentage of bars where the close price is higher than the open price for each stock in the watchlist over the last 10 bars, & then average those percentages to get the overall percentage of bullish bars for the watchlist over the last 10 bars.

To get the percentage bullish number
The code divides the total number of bars where the close price is higher than the open price by the total number of bars for all the stocks in the watchlist over the specified nPeriod, & then multiplies by 100 to get a percentage value.

To clarify the two percentage values
The first percentage value (the one calculated over the specified nPeriod for the watchlist as a whole) is used to determine whether the overall market sentiment for the watchlist is bullish or bearish. The second percentage value (calculated for each individual stock in the watchlist) is used to determine whether each stock is bullish or bearish on a short-term basis.

Skate.
 
Hi, I've seen some discussion on the value of AI. I put a question into chatgpt and this is the code generated. I have no idea whether this works

Everyone is entitled to their opinion
@CNHTractor ChatGPT makes lots of mistakes coding an AFL & it doesn't grasp array processing all that well. The issue with AI models is that they will always come up with an answer, whether it's true or not. When it comes to Amibroker coding ChatGPT will use non-existing function names & at times will make them up on the run. ChatGPT appears at this stage to get its information from various sources rather than directly from the AFL Function Reference page or Amibroker Knowledge Base.

AI is not perfect & can make mistakes
AI language model has no concept of "truth" or "fact" which is why it produces code that would look okay on the surface but lacks depth & accuracy. ChatGPT is a fun tool at the moment but when it comes to coding the more I play with it the more it disappoints.

Skate.
Hi @Skate, very true. Just plugged the code in - and it has heaps of errors. When it is pointed out in ChatGPT it changes but still wrong.

It still has a way to go. I just thought it was an interesting exercise, as I had seen ChatGPT being discussed in another thread.
 
ChatGPT being discussed in another thread

@CNHTractor I haven't read the ChatGPT thread, but I have played around with ChatGPT when it was touted to be the next best thing. There may be times when exploring different tools & technologies, can be just as educational & stimulating. As with any new technology, there will always be a period of adjustment & improvement. While ChatGPT may not always provide the most accurate or relevant responses, it can still be a useful fun tool.

Skate.
 
Let me clarify further ( "PercentageUp Filter" )
The percentage of stocks in a watchlist that has closed higher than their open price over a specified nPeriod is calculated by taking the average of the percentage of bars where the close price is higher than the open price for each stock in the watchlist over the nPeriod.

For example
If the nPeriod is set to 10, the code will calculate the percentage of bars where the close price is higher than the open price for each stock in the watchlist over the last 10 bars, & then average those percentages to get the overall percentage of bullish bars for the watchlist over the last 10 bars.

To get the percentage bullish number
The code divides the total number of bars where the close price is higher than the open price by the total number of bars for all the stocks in the watchlist over the specified nPeriod, & then multiplies by 100 to get a percentage value.

To clarify the two percentage values
The first percentage value (the one calculated over the specified nPeriod for the watchlist as a whole) is used to determine whether the overall market sentiment for the watchlist is bullish or bearish. The second percentage value (calculated for each individual stock in the watchlist) is used to determine whether each stock is bullish or bearish on a short-term basis.

Skate.
Got it, thank you for your clarification @Skate, that was very kind of you.

This part
"The second percentage value (calculated for each individual stock in the watchlist) is used to determine whether each stock is bullish or bearish on a short-term basis."

I take it that this second % value is only used for other applications, such as exist or ranking etc etc.. but it has no usage in the actual Percentage up filter, either for the ribbon and its bolean value 50, 25 etc, or in the actual indicator showing the actual % up on the chart. Right?
 
I take it that this second % value is only used for other applications

Correct.

it has no usage in the actual Percentage up filter

Incorrect, as the "PercentageUp Filter" is the name of the filter. The "PercentageUp Filter" is a simple timing filter that IMHO has a high correlation to the index I trade the ASX (All Ordinaries). When the markets are bullish, the "PercentageUp Filter" above (50%) Buy positions can be taken. When the filters turn bearish under (25%) it is annexed with an additional code as an additional exit strategy.

Skate.
 
This part
"The second percentage value (calculated for each individual stock in the watchlist) is used to determine whether each stock is bullish or bearish on a short-term basis."

I take it that this second % value is only used for other applications, such as exist or ranking etc etc.. but it has no usage in the actual Percentage up filter, either for the ribbon and its bolean value 50, 25 etc, or in the actual indicator showing the actual % up on the chart. Right?

Let me clarify further ( "PercentageUp Filter" )
The "PercentageUp Filter" is a timing filter that I believe has a strong correlation to the ASX (All Ordinaries) index I trade. This filter is designed to identify bullish or bearish market conditions based on the percentage of stocks in the index that are trading above a certain level.

The "PercentageUp Filter" indicates bullish & bearish market conditions
Specifically, when the "PercentageUp Filter" is above 50%, it suggests that the market is bullish, & this is the only time the strategy will generate buy positions. On the other hand, when the filter drops below 25%, it indicates a bearish market that times my exits of existing positions. Overall, I find the "PercentageUp Filter" to be a useful tool in my trading strategy, as it helps me stay attuned to market conditions.

The "PercentageUp" ribbon
When the ribbon is "Green" the filter is equal to or above 50% being TRUE, all other times it's below 50% being FALSE the ribbon displays red.

Skate.
 
The "PercentageUp Filter" indicates bullish & bearish market conditions
Specifically, when the "PercentageUp Filter" is above 50%, it suggests that the market is bullish, & this is the only time the strategy will generate buy positions. On the other hand, when the filter drops below 25%, it indicates a bearish market that times my exits of existing positions. Overall, I find the "PercentageUp Filter" to be a useful tool in my trading strategy, as it helps me stay attuned to market conditions.

2023.jpg

We all had high hopes for 2023
It's no secret that many of us had high hopes for 2023, but unfortunately, the year has proven to be quite challenging for many. While there have been some bright spots, it's clear that success this year requires staying on top of your game. Of course, it's important to remember that the market is unpredictable & can change rapidly. What works well in one market condition may not work in another. I've found that using lagging indicators can result in false signals that can be detrimental to your success.

Everyone is entitled to their opinion
As traders, we must prioritise evidence-based strategies that can help us achieve our goals. it's essential to avoid meaningless market timing strategies & instead focus on strategies that have proven to be successful. Over my last series of posts, my "PercentageUp Filter" has demonstrated a high correlation to the index I trade, the ASX (All Ordinaries).

More to follow.

Skate.
 
It's important to back up claims with actual trading results
So while we may have had high hopes for 2023, it's important to stay vigilant & adaptable to the ever-changing market conditions. With the right strategies & mindset, we can still achieve our goals & succeed despite the challenges that may arise. Over time I've found that using lagging indicators such as an Index Filter allows you to produce a lot of false signals, signals that really hurt profitability. But in saying this it's better than nothing. All I'm saying is to consider alternatives.

2023 has been a challenge
It's crucial to stay on top of your game & stay adaptable to unpredictable market conditions. Using lagging indicators to trade can lead to, so it's essential to focus on strategies that have proven successful. Despite the challenges that may arise, with the right strategies & mindset, we can still succeed & thrive in the ever-changing market conditions of 2023. One critical aspect of any strategy is backing up claims with actual trading results. Using lagging indicators like an Index Filter can result in a lot of false signals that hurt profitability, so it's essential to consider alternative options.

Skate.
 
Skate's 200k Strategy.jpg

Trading a 200k strategy is well within the reach of a retiree
It's important to acknowledge that trading a 200k strategy is well within the reach of a retiree, but it's essential to approach trading with caution & a willingness to adapt to changing market conditions. During volatile times, strategies that rely on a simple moving average index filter & a trailing stop may not be sufficient for effective trading. Recent volatile markets have shown that these strategies may not be as effective in trading this year.

To adapt to volatile markets
Traders need to consider more sophisticated strategies that can help them identify & respond to market changes quickly. For example, incorporating a more efficient market timing filter with a volatility-based stop-loss can help traders limit their losses in volatile markets while still allowing for potential gains. It's crucial for traders to be willing to adjust their strategies & risk management techniques as needed to ensure they are effectively managing risk & maximising profits.

Actual trading results to follow.

Skate.
 
Capital is the name of this game
Having access to capital is a crucial factor in determining the level of trading aggression on a personal level. When financial circumstances change, it is important to reassess your trading strategy & adjust accordingly. For example, @qldfrog has decided to pull back on trading & invest his capital in another direction, while I recently sold an asset & used the funds to experiment with a new strategy that has yielded promising backtest results.

The 200k Strategy
This strategy has been coded from ideas I've posted about & the "PercentageUp Filter" is at the heart of the strategy. This indicator is a pure timing filter that allows buying signals to be generated when the percentage of the index (XAO) is over 50%. Whereas sell signals are generated at will when the percentage of the index (XAO) is 25% or below. However, it's my opinion that traders need to consider more sophisticated ways to trade that can help them identify & respond to market changes quickly. Ultimately, having access to adequate capital can provide traders with the flexibility & resources necessary to pursue their trading goals & achieve success in the ever-changing market conditions.

The (XAO) Chart
2023 has been a year of significant volatility, as shown in the chart below. During such unpredictable times, it's essential to have effective strategies in place to manage risk & maximise profits. The "PercentageUp" ribbon & filter, demonstrate the effectiveness of timing filters during volatile markets. With the right strategies & mindset, we can still succeed & thrive in the ever-changing market conditions of 2023.


XAO High Hopes.jpg

Skate.
 
Skate's 200k Strategy.jpg

This strategy kicked into gear on the 1st of January 2023
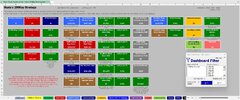
To provide a more comprehensive view of the trading results achieved, I've included the "Share Trade Tracker" dashboard. The strategy I've been using, which incorporates the "PercentageUp Filter," kicked into gear on January 1st, 2023. In the following posts, I will show how the actual results and backtest results are somewhat aligned, but not exactly due to the way Amibroker Backtest results are calculated.

I prefer to trade during the pre-auction phase and generate signals using the "Explore Analysis" feature
Why? Because it allows for precise calculations displaying the results in any format I desired. This approach has helped me to accurately track my progress & make informed decisions to optimise my trading performance.

STT 200k Dashboard.jpg

Skate.
 
No doubt about it 2023 has been a tough trading year
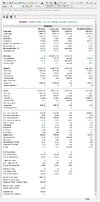
2023 has indeed been a challenging year for traders due to the volatility of the market. However, despite the difficult circumstances, my actual trading results are in line with the backtest results. It's essential to understand the discrepancies between backtesting & actual trading results, such as the way the backtest is calculated & the known opening price. It's essential to note that trading in the pre-auction comes with its own unique set of challenges, such as not knowing the opening price, which can impact the accuracy of the backtest results. The backtest result indicates I should be $14,496.34 in front whereas my TRUE trading results are $14,861.

BT TOP.jpg


200K Portfolio Equity.jpg

Skate.
 
This is the Backtest Analysis window
That shows the signals generated by the strategy. Some traders prefer to trade the signals from the backtest, but I prefer to use the Exploration Analysis window. This way, I can customize the signals to match the format of entry into my brokerage account. By doing so, I can achieve more accurate results in my trading, & it also helps me to fine-tune my strategy to suit my needs better. The signals below are all the signals for "The 200k Strategy" from the 1st of January 2023 to yesterday Friday the 6th of April.

BT Analysis.jpg

These are the same signals from the Exploration Analysis window
The signals below are from the 1st of January 2023 to yesterday Friday the 6th of April. As I said taking signals this way allows me to customize the analysis & signals to match the format of entry into my brokerage account.

Exploration Analysis.jpg


The downside of using the Exploration Analysis window
The Exploration Analysis window, although offering more flexibility, has its downside. Unlike the Backtest Analysis window, it displays all the raw signals generated by the trading strategy. This can be overwhelming & requires careful consideration before taking any action. In contrast, the Backtest Analysis window is more restricted in terms of the parameters of the trading strategy. It only generates buy signals to fill the maximum positions & sell signals that are held in the portfolio. While this restricts the signals generated, it provides a more streamlined approach to trading for some.

Skate.
 
Skate's 200k Strategy.jpg

Results in a more digestible manner
To make the results more digestible & easy to understand, it's important to present them in a clear & organised manner. One way to do this is by creating a summary table or chart that shows the weekly trading results of this strategy. Doing so I believe it can help traders quickly assess the effectiveness of the strategy & make informed decisions about whether to continue using it or make adjustments.

Another important aspect is to highlight the importance of patience & discipline in trading
Sometimes, the best move is to do nothing & wait for better market conditions. This can be a challenge for some traders who may feel the pressure to constantly make trades & take action. However, by staying disciplined & following the strategy, traders can increase their chances of success over the long term. Sitting on your hands at times adds a uniqueness to this strategy

Results T.jpg

Skate.
 
Whats going on here.jpg

Patterns are everywhere
In a nutshell, systematic trading involves using a set of predefined rules to generate buy & sell signals. One of the primary ways that systematic traders can take advantage of repeatable patterns is through technical analysis, which involves evaluating market activity such as price & volume. By using technical indicators, traders can identify patterns that can provide early warning signals for potential price movements & help them identify entry & exit points.

If you are not making money trading this financial year, you are doing something wrong
In addition to technical analysis, systematic traders can also utilize quantitative analysis, which involves using mathematical models to identify patterns in data & make predictions about the probability of future market movements. By taking advantage of repeatable patterns in the market, systematic traders can generate consistent profits over time.

Skate.
 
If you are not making money trading this financial year, you are doing something wrong

Uptrending.jpg

This financial year is in an uptrend
Price charts are an essential tool for traders as they provide a visual representation of the price action over time. Interpreting the information presented on a price chart allows traders to make informed trading decisions. It's important for traders to have a solid understanding of the elements presented on the chart, such as timeframes, price movements, indicators, & patterns, & how they interact to develop a successful trading strategy.

While the ASX (All Ordinaries) may be experiencing a sustained upward trend
It's important for traders to remain grounded & realistic in their expectations. Even in an uptrend, there are inevitable setbacks & corrections. Traders should be aware of the risks & uncertainties that could impact their trading performance. By remaining aware of these factors & utilising the tools & strategies available to them, traders can position themselves for success & avoid the pitfalls we all face.

Skate.
 
Top