
MovingAverage
Just a retail hack
- Joined
- 23 January 2010
- Posts
- 1,315
- Reactions
- 2,565


before placing any faith in your simulation results
Hi @Skate: sorry, any chance you can elaborate a bit more--not sure I understand the point correctly.@MovingAverage I've cherry-picked 8 words out of your post (which was great by the way) to explain an anomaly that I find hard to accept. Let me explain, a trend trading system can produce a variety of results depending on filters & parameters used in your buy condition. For a second let's assume the backtests results were unfavourable. Now backtest the strategy with the same buy condition coded completely opposite as before. All logic would indicate that reversing the signals that generated a loss would now generate a win, but it's never the case.
Skate.
Hi @Skate: sorry, any chance you can elaborate a bit more--not sure I understand the point correctly.

why you need to be able to think on your feet.
I now understand your point, but to be honest I'm still missing the connection between my last post on appropriate trade count for system testing and using an opposite buy condition for entries--they call me an idiot for good reasonsif you reverse your buy condition (to one one you just used) meaning, the condition to be completely opposite it doesn't mean your results will be opposite.
I now understand your point, but to be honest I'm still missing the connection between my last post on appropriate trade count for system testing and using an opposite buy condition for entries--they call me an idiot for good reasons
Back to your point--I wouldn't expect that using a completely opposite entry condition would necessarily lead to a completely opposite result. If I reversed my entry conditions it might do well for shorting
If I reversed my entry conditions it might do well for shorting
@MovingAverage, your post invoked a memory for me (that wasn't directly related to your post ) that allowed me to make a post out of eight words that you had used. Explaining what I have found doing a backtest was for those who like to play (fiddle) with their code looking for improvements. Meaning if this buy condition didn't work, doing exactly the opposite should, which is not the case.
I was trying to think on my feet when you said "please explain"
Well, as I was going from memory I couldn't code up something quickly enough that would explain what I was trying to get across. All it did was to "invoke another memory" about why it's so important to think quickly on your feet.
Mike Tyson once said
"Everyone has a plan till they get punched in the face". With boxing, if you don't think quickly on your feet you will be knocked off them.
Thinking on your feet
After making my post, it Invoked another memory of the joke about thinking quickly to get yourself out of a sticky situation. Posts are light on these days in the "Dump it here" thread so posting about "this & that" at least gives others something to read, keeping the thread active.
Skate.
Happy Friday Y'All,
Well I bang on about making sure you use a statistically relevant number of trades before placing any faith in your simulation results--not enough trades and your results are worthless and too many trades can be a waste of CPU cycles, your time and unlikely to give you any further insight.
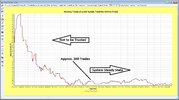
I was recently doing an analysis of a system and was reviewing some simulation charts and thought the below chart highlighted the importance of understanding what the relevant number of trades for your system simulations is. What you see below is the winning percentage of trades over time and I'm just using this as a simple example. This chart was generated using TradeSim and while I would like the X axis to show trade count and not date unfortunately TradeSim only allows me to show date. Nonetheless this is not a big deal as I explain below.
The important thing to note with the chart below is the date range of June to Oct 2018. Prior to this date the simulation has executed less than about 300 trades and obviously after that date the system has executed more than 300 trades. You can see that up to the 300 trade mark the winning trade % goes up than then slowly down to what is referred to as the "system steady state" (300 trade mark around June / Oct 2018) where is settles at around the 58% winning trade level.
What's the big deal I hear you say--well simulating this system with less then approximately 300 trades is a complete and utter waste of time and will only lead to misleading simulation results. Simulating this system with 1000 trades will be a complete waste of time and unlikely to yield any additional confidence in your simulation results. Personally, I think simulating this system with around 500 trades would be adequate to give you a reasonable level of confidence that the system has reached steady state and the simulation results are reasonably insightful.
Please do not make the mistake of saying using only 500 trades would not span different market conditions and therefor you must use 20 years of data--wrong! This is where walk-forward testing on OOS data is important so you can understand how your system performs across all market conditions and how robust (or not, as the case may be) your system is and what market conditions it performs poorly in.
Stay classy ASF.
View attachment 143242
All part of the serviceAn informative post, thanks for giving us the benefit of your work.
Happy Friday Y'All,
Well I bang on about making sure you use a statistically relevant number of trades before placing any faith in your simulation results--not enough trades and your results are worthless and too many trades can be a waste of CPU cycles, your time and unlikely to give you any further insight.
I was recently doing an analysis of a system and was reviewing some simulation charts and thought the below chart highlighted the importance of understanding what the relevant number of trades for your system simulations is. What you see below is the winning percentage of trades over time and I'm just using this as a simple example. This chart was generated using TradeSim and while I would like the X axis to show trade count and not date unfortunately TradeSim only allows me to show date. Nonetheless this is not a big deal as I explain below.
The important thing to note with the chart below is the date range of June to Oct 2018. Prior to this date the simulation has executed less than about 300 trades and obviously after that date the system has executed more than 300 trades. You can see that up to the 300 trade mark the winning trade % goes up than then slowly down to what is referred to as the "system steady state" (300 trade mark around June / Oct 2018) where is settles at around the 58% winning trade level.
What's the big deal I hear you say--well simulating this system with less then approximately 300 trades is a complete and utter waste of time and will only lead to misleading simulation results. Simulating this system with 1000 trades will be a complete waste of time and unlikely to yield any additional confidence in your simulation results. Personally, I think simulating this system with around 500 trades would be adequate to give you a reasonable level of confidence that the system has reached steady state and the simulation results are reasonably insightful.
Please do not make the mistake of saying using only 500 trades would not span different market conditions and therefor you must use 20 years of data--wrong! This is where walk-forward testing on OOS data is important so you can understand how your system performs across all market conditions and how robust (or not, as the case may be) your system is and what market conditions it performs poorly in.
Stay classy ASF.
View attachment 143242


Anyway, it is wine o'clock for me so I'll say "over and out" so I can ponder what a lion, dog and monkey can teach me about trading.
and my reference was intended only as friendly banter and light-hearted break from the very dry and unfunny topic of system testing--nothing more and nothing less@MovingAverage it was a light-hearted way to demonstate why quick-thinking is an art, not a science.
Skate.
Any one use an overbought filter for entries on their breakout systems?

what indicator did you use?No joy for me
I would say most system traders have tried many different varieties using this indicator. As you have started using the over brought side of the indicator I've added to the buy condition. I've not found it to be helpful & most times a hindrance. I should also say I trade many strategies & none use this indicator.
The “Over brought indicator”.what indicator did you use?
The “Over brought indicator”.
The better question would have been “how did you use the indicator?”.
@MovingAverage how did you use the indicator?
Skate.
I’m missing the point here—brought bought ?The “Over brought indicator”.
The better question would have been “how did you use the indicator?”.
@MovingAverage how did you use the indicator?
Skate.
We use cookies and similar technologies for the following purposes:
Do you accept cookies and these technologies?
We use cookies and similar technologies for the following purposes:
Do you accept cookies and these technologies?