Australian (ASX) Stock Market Forum

Bitcoin price discussion and analysis

Some interesting news from the lovely crew at the Global Times.

China to shut down over 90% of its Bitcoin mining capacity after local bans - Global Times

A snippet;

"That means that more than 90 percent of Bitcoin mining capacity, or one-third of the global crypto network's processing power, will be suspended in the short term. As a result, Chinese miners must form alliances to migrate overseas, to places such as North America and Russia," Shentu noted.
 
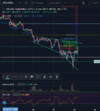
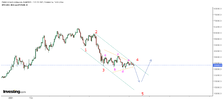
Got a nice entry position in to BTC on futures last night. A broadening descending wedge within a broadening descending wedge. The bull flag coming out of the smaller one lines up nicely with the middle of the trading range we've been in for a month.
1624412277629.png

I used a trailing buy order with a $1000 trail limit to try and get close to the bottom - hoping not to get wicked in on a larger downward move.
 
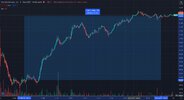
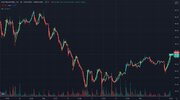
Yep, there was another beautiful scalp to be had with RIOT because of it too:

12351235125.jpg
 
Yeah, you just have to buy it with fedcoin. No biggie.
 
I remember back in the early 80's sitting in the 'Gully pub on the banks of the Moonie River and talking to a bloke who had been a rear gunner with the RAF over Europe during WW2.

He said it was equal parts terror, excitement and fear but the best thing was throwin' a leg over afterwards.

To the victors the spoils.

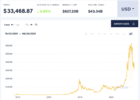
This is not going to end well. A long term chart with a terrifying head and shoulders about to declare as we speak.

Screen Shot 2021-06-24 at 4.45.34 am.png

gg
 
We had a clue that all was not well at the peak with the wedge or ending diagonal pattern. The rest is history.
Interestingly similar pattern tracing out in the DAX and NDX.
How much of a decline that results in is anybody's guess but it will be sharp when it gets started.
 
We had a clue that all was not well at the peak with the wedge or ending diagonal pattern. The rest is history.
Interestingly similar pattern tracing out in the DAX and NDX.
How much of a decline that results in is anybody's guess but it will be sharp when it gets started.
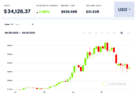
I would agree. I am uploading a weekly chart over the past year on BTC. It is possible we are looking at USD$20,000.

Soon.

BTC 12mo. weekly.png

gg
 
Fine by me:

12345125123.jpg

Honestly, if you're not buying crypto dips & flipping them you're a fool at this point. Every single one of those arrows represents at least a 10% scalp, some as high as 20%, and usually within 24 hours, and there's been several more since.
 
The Bitcoin price is now fairly steady moving between $32,000 and $35,000 and has done so for a week or more. Shares I hold NASDAQ: RIOT is behaving differently. Having touched $22 when Bitcoin reached $29,000 but now at $34 with Bitcoin at around $33,000. So for shares on the NASDAQ, the crypto situation is improving for them but not for the likes of LSE: ARB on the London market AIM. However, ARB now intends to apply for the NASDAQ.
 
are you using a different system other than transcribed by Bolton/Charles/Prechter ?
keen to understand these interpretations, respectfully
Not I am not. My best guess atm current pattern just completed a wave 4 running triangle.
 
Top