- Joined
- 6 May 2005
- Posts
- 318
- Reactions
- 1
AUSSIE DOLLAR... here we go again?
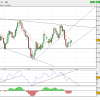
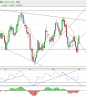
These charts represent 2 key factors that I am trying to illustrate...
The 3rd chart pay close attention to the triple bottom formation possibilty and at the same time look at the stochastics oscillators.
and the other important observation is
On the 2nd chart ...prices have rallied and hit resistance at 618% retracement level and is selling off from since last week.... this is one of the observations that I was trying to explain to tech/a about a month ago about fibonacci retracement levels.
Bottom line, from the perspective of this 2nd chart in this post.... prices haven't broken out yet.... the neckline in this head and shoulder pattern is very important... if prices start climbing towards the neckline of .7750.... Gold and silver will probably be spiking also..
Let's watch and see if this one starts to pan out......
TRADE AT YOUR OWN RISK… The purpose of these charts is to point out significant highs and lows based on Fibonacci Retracement lines and Elliott Waves which are highly subjective . This information is for educational purposes and should not be considered trading recommendations . All trading decisions are your own sole responsibility …


