Australian (ASX) Stock Market Forum

Amibroker FAQ

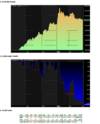
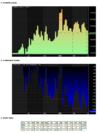
Beware - survivorship bias as Lone Wolf and Richard describe can be damned nasty for backtests and real life trading. Here's the same weekly trend following system, with backtest runs since the 2020 Covid crash.

First run on All Ords only with no constituent monitoring (so incorrectly includes trades on shares that will enter the All Ords , or have already left).

Next one is with proper constituent check and historical tickers. Ouch!

(No affiliation with Norgate, but personally believe few extra hundred $$$ for platinum subscription is money well spent).
1626084576346.png


1626084654152.png
 
You've just encountered survivorship bias.

Since you're already a user of our data, you might want to make use of the All Ordinaries Current & Past watchlist and also the NorgateIndexConstituentTimesSeries() in your backtesting.

Also see this, so you exit a position on a backtest prior to delisting:
(if you don't, your system will be stuck in that position)
Thanks Richard. I do use the current and past watchlist for backtesting. But until yesterday it hadn't occurred to me that I should be using it for entry/exit explorations as well. It makes sense when you think about it, I just never did.
 
I downloaded Amibroker. I purchased Professional. I've activated the key.

I am using Premium Data.
I go to "open database," select Premium Data and it loads the data fine.

I mark up a chart, and then click "save database"

Each time I open Amibroker, all the changes are GONE, and so is the data.
I have to click "open database" each time to get the data.

Why is this?
How do I fix it?
Unless I misunderstand your question I think you'll need to save as chart not database. When on your chart go to "File" menu and select "save as". This should default to save as a .chart file, enter your file name and save. This should then open with your mark-ups. Hope this helps
 
I
Unless I misunderstand your question I think you'll need to save as chart not database. When on your chart go to "File" menu and select "save as". This should default to save as a .chart file, enter your file name and save. This should then open with your mark-ups. Hope this helps
Ill give it a try!

I wonder why when I open Amibroker it doesn’t open up automatically with the most recent data that I updated.
The most recent data is 2014 when I last used Amibroker!
Every time I open it. Even if I’ve updated the data the previous time I used it!
 
I

Ill give it a try!

I wonder why when I open Amibroker it doesn’t open up automatically with the most recent data that I updated.
The most recent data is 2014 when I last used Amibroker!
Every time I open it. Even if I’ve updated the data the previous time I used it!
Are you using Norgate data?
 
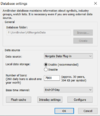
What does your Database Settings dialogue look like? I seem to recall having similar probs with Premium Data years ago when was subscribed to both Aus and US but can't remember exactly how sorted it. Norgate Data is worth switching too if/when you get around to it.....


1653902402493.png
 
I lost the display of my watchlist, and where I can enter the symbols to load up new charts.
All that I have on the screen is ONE CHART.

How do I get that all back?
 
Windows I think did an upgrade and I lost my watchlist. Not sure what you lost.

I did FILE, OPEN DATABASE, then scrolled down to MY NEW DATA, fixed my problem.

Hope that helps
 
Cesar Alvarez has an interesting article from back in 2018:
He says his mean reversion system improved greatly when he changed his stock universe to "stock is not in Russell 3000 index but was so in the past."
It looks like Norgate data can support this, but I can't understand how this rule would be coded. Norgate website says you can use the function NorgateIndexConstituentTimeSeries, but not how to use it the way Cesar describes.
Has anyone tried something similar in the past?
 
Wasp, not sure what you have in US data subscription, but would it be possible to run the backtest/screen on Current and Historical constituents then look for tickers not currently in Russell 3000?
 
Wasp, not sure what you have in US data subscription, but would it be possible to run the backtest/screen on Current and Historical constituents then look for tickers not currently in Russell 3000?
I've got the USA platinum, so I do have the current and historical index constituents, however I don't know how to use the code in a way that both includes historical constituents, but also excludes the same stocks from the index as it is today.
 
Cesar Alvarez has an interesting article from back in 2018:
He says his mean reversion system improved greatly when he changed his stock universe to "stock is not in Russell 3000 index but was so in the past."
It looks like Norgate data can support this, but I can't understand how this rule would be coded. Norgate website says you can use the function NorgateIndexConstituentTimeSeries, but not how to use it the way Cesar describes.
Has anyone tried something similar in the past?
You could try this:

Filter settings
Include => Watch List: Russell 3000 Current & Past
Exclude => Watch List: Russell 3000
 
Beware of future information leak for a backtest in the filter described above. It'll work for a current scan but not for a backtest.

Cesar specifically states that he want to _backtest_ stocks that were _previously_ in the R3K but not at the time of the signal.

So, you need to code it something like this (quickly whipped up 1 min)

Code:
#include_once "Formulas\Norgate Data\Norgate Data Functions.afl"
r3kMember = NorgateIndexConstituentTimeSeries("Russell 3000");
barsSinceR3KMember = BarsSince(r3kMember);
previousButNotCurrentR3Kmember = !IsNull(barsSinceR3KMember) AND r3kMember == 0;
Plot( previosButNotCurrentR3Kmember, "previosButNotCurrentR3Kmember",  colorYellow, styleLine , Null, Null, 0, 2,-10  );

majorExchangeListed = NorgateMajorExchangeListedTimeSeries();
originalClosePrice = NorgateOriginalCloseTimeSeries();

rsi2SignalANDR3KPreviousMember = previousButNotCurrentR3Kmember == 1 AND majorExchangeListed == 1 AND
                                 originalClosePrice > 1 AND MA(C*V,21)>500000 AND  C > MA(C,100) AND RSI(2) < 10;

//Plot( previosButNotCurrentR3Kmember, "previosButNotCurrentR3Kmember",  colorYellow, styleLine , Null, Null, 0, 2,-10  );
Plot( rsi2SignalANDR3KPreviousMember, "previousButNotCurrentR3Kmember",  colorBlue, styleLine , Null, Null, 0, 2,-10  );

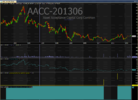
You can see the commented-out plot of previosButNotCurrentR3Kmember variable versus the R3K membership status on the stock AACC-201306 here to verify it's working correctly:

1659592815420.png

(here, you can see that in June 2011 it was dropped from the R3K and re-entered the R3K in June 2012, so the intervening period is showing as tradeable according to Cesar's constituent rules, but not anywhere else).
 
Beware of future information leak for a backtest in the filter described above. It'll work for a current scan but not for a backtest.

Cesar specifically states that he want to _backtest_ stocks that were _previously_ in the R3K but not at the time of the signal.

So, you need to code it something like this (quickly whipped up 1 min)

Code:
#include_once "Formulas\Norgate Data\Norgate Data Functions.afl"
r3kMember = NorgateIndexConstituentTimeSeries("Russell 3000");
barsSinceR3KMember = BarsSince(r3kMember);
previousButNotCurrentR3Kmember = !IsNull(barsSinceR3KMember) AND r3kMember == 0;
Plot( previosButNotCurrentR3Kmember, "previosButNotCurrentR3Kmember",  colorYellow, styleLine , Null, Null, 0, 2,-10  );

majorExchangeListed = NorgateMajorExchangeListedTimeSeries();
originalClosePrice = NorgateOriginalCloseTimeSeries();

rsi2SignalANDR3KPreviousMember = previousButNotCurrentR3Kmember == 1 AND majorExchangeListed == 1 AND
                                 originalClosePrice > 1 AND MA(C*V,21)>500000 AND  C > MA(C,100) AND RSI(2) < 10;

//Plot( previosButNotCurrentR3Kmember, "previosButNotCurrentR3Kmember",  colorYellow, styleLine , Null, Null, 0, 2,-10  );
Plot( rsi2SignalANDR3KPreviousMember, "previousButNotCurrentR3Kmember",  colorBlue, styleLine , Null, Null, 0, 2,-10  );

You can see the commented-out plot of previosButNotCurrentR3Kmember variable versus the R3K membership status on the stock AACC-201306 here to verify it's working correctly:

View attachment 144935

(here, you can see that in June 2011 it was dropped from the R3K and re-entered the R3K in June 2012, so the intervening period is showing as tradeable according to Cesar's constituent rules, but not anywhere else).
Thank you Richard, I had not considered this. Best customer service ever ?
 
Top