- Joined
- 28 March 2006
- Posts
- 3,566
- Reactions
- 1,309
...
this stock has yet to disappoint and is certainly a long term hold.
I wonder if it can repeat the past run, amazing results again yesterday.
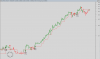
Weekly chart.
...
this stock has yet to disappoint and is certainly a long term hold.
Strong buying / large volume at close of trading today.
closed shy off its recent highs of 0.72 cents
The chart is looking very good for a break out.
Could be some instos loading up or potential takeover, regardless of the outcome CAJ is going north from here.
Cheers
leyy

 and also I didn't top up on the cap raising for the two acquisitions... as CAJ is already my largest holding... far too large. Can't be too greedy i guess already up circa 400% on this.
Catching the falling knife, I recently bought into CAJ on fundamentals alone. Amazing that this company recently retraced 50% of the price run from the beginning of 2012 to March 2015 and a 100% retracement to the December 2014 low.
The price has made a double bottom over the past couple of weeks.
.
Catching the falling knife, I recently bought into CAJ on fundamentals alone. Amazing that this company recently retraced 50% of the price run from the beginning of 2012 to March 2015 and a 100% retracement to the December 2014 low. The price has made a double bottom over the past couple of weeks.
The interview of the MD by Alan Kohler in 2014 is worth watching for anyone interested in the validity of the growth by acquisition strategy.
https://www.youtube.com/watch?v=yzv3fMTi3TU
Also worth keeping an eye on is the upcoming I-MED radiology IPO.
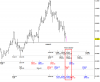
No idea about fundamentals but an interesting cluster of time projections in September/October. Yep, a large target in terms of time but below is the weekly chart so acceptable when looking at the larger degree patterns. Bottom line is that this area of support needs to hold.
It also looks like a 5-wave move down off highs so looking for a larger bounce as opposed to a multi-year trend higher. Target area $0.85 - 0.90.
Those Time clusters look very interesting Porper.
What does your EW look like on the weekly/monthly chart?
With a chart like this it's often better to use semi-log which is what I've done here. A rise of over 3600% since late 2011 means we can better label the early patterns. A significant top could well be in although a decent bounce from here is likely i.m.o.
We are at the two strongest price levels at the moment.
50% of the All time high and 50% of the All time range
So a bounce is on the cards from here in my opinion.
This move lower has been supported with increased volume and to me looks like further falls are likely and $0.44 looks likely at the moment imo.
The bounce never came but it never hit my stop loss either and the fundamentals on which I invested haven't substantially changed.
In fact, I had an order in at $0.45 which triggered this morning and seeing as I am in neck deep now, picked up some more at 40.5c - so am sitting with a holding under the water at 52c per share.
I assume that the guidance update issued last night accounts for today's collapse in the share price (Vic operational weakness, lower anticipated referrals, revenue for full year expected to be down 4-6% on forecast) rather than the investment into Enlitic announced this morning.
The Enlitic investment is interesting. I also like that they are offering their radiologists a slice of that investment. CAJ will be feeding their data and archived data to Enlitic to feed into their deep learning programs. Fascinating if nothing else.
That was the fastest 3Y i'd ever seen.
Director buys some stock on market @ 42c and immediately tells the world... seems pretty desperate!
Hello and welcome to Aussie Stock Forums!
To gain full access you must register. Registration is free and takes only a few seconds to complete.
Already a member? Log in here.