Australian (ASX) Stock Market Forum

Descending Triangle Breakouts - My World

Status
Not open for further replies.
Joined
5 January 2006
Posts
536
Reactions
0
Hi All

Thought I'd publish a series of trades and the set ups I look for.

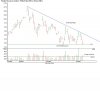
For want of a better description I call them descending triangle breakouts. This is the only pattern I ever look for and routinely occurs in daily, weekly, monthly charts.

What I believe is happening is that patient buyers, represented by the horizontal blue support line, are allowing sellers to exhaust themselves, the sloping red line.

I need to see at least two attempts at a rally, points 1 and 2, with failure.

The entry signal is always a white candle breaking into new air. Confirming volume on the entry day, week, month is great to have too, although not mandatory.

I'm basically looking for a controlled constrained market who's tightening ends in violence, the breakout signal.

I have variations that I allow through experience over the years ...

More to come ...

Feel free to post any charts that could be discussed.
 

Attachments

  • GRD - Example.gif
    GRD - Example.gif
    59.6 KB · Views: 1,072
Dutchy I have been reading your posts and like your style. Simple but effective. What is your strike rate? Success failure of this method?
 
Snake - on a weekly set up better than 65% and the really good thing is that when I'm wrong STOPs are tight. The quality of the breakout signal often is a precursor to actual success. I have a weakness of being cute at around mid-day entering some positions only to see it sell off on the CLOSE. I need to wait until the last 10 minutes of the day, week, month in order to raise my confidence levels in this respect.

Daily charts I need to be much more circumspect in that I still need to be confident that the weekly trend in still bullish. Don't want to be suckered into a stage IV stock ... which has happened ...

Its the potential for % return verses the risk on entry that keeps me just focused on this one pattern. AGM has returned 400% is little over 12 months and prior to that LHG nearly 250% ... I took a position in ABY during the week so lets see how that goes ....

Dutchy,

Nice work.

You mention a stage iv stock. Whose school of thought is that? The stages?
I am in EW land at the moment and my brain is tired:) Distributing stock.

The trendline appears to be subjective but logical. Are there any rules determining the placement of it?
 
Yes ... Weinstein Profits in Bull and Bear Markets and Bedfords CandleStick Secrets talk of share stages. Very macro view ... keeps me out of trouble though. EW within each stage.

Look at the attached unfolding CMO. Points one and two black weeks and absolute textbook locations. Increasing volume on the breakout ... all my entries are looking for at least two failures with success on the third attempt. Bit of Gann in that me thinks. The longer, flatter and more % volatility within the triangle seems to generate more power on the breakout and rapid SP increase consequently.
 

Attachments

  • CMO - example.gif
    CMO - example.gif
    76.5 KB · Views: 1,018
Hi Dutchy

Thanks for posting the thread

How do you define your exits?

Focus
 
Dutchy3,

You say the attached unfolding CMO. Hasn't it already unfolded?

Are you still in this stock? Personally I think that CMO has turned a bit bearish. Lows are now being followed by lower lows.
 
Exits for me are when the stock CLOSES below the most recent big white into new air.

So for CMO its the week ending 23/02/07 and the price .02.

The real issue for me with exits is opportunity cost. For the past 6 weeks CMO has traded sideways. What would of been the next best allocation for my capital tied up in CMO that could of been allocated to something else that was running?

This is the allure of the market ...
 
Great posts Dutchy, i've been wondering how this has been working to you too. Do you scan for these setups?

Cheers,
 
This is a very interesting strategy Dutchy, thanks for sharing and congratulations on doing well with it. I look for bases like the ones you appear to be trading, would this be an accurate description, search for accumulation and the final breakout once supply dries up? Tried similar patterns like saucers and box consolidations but never with the specificity that you show here. Keep it up!
 
Dutchy.

These are an excellent setup. Preceeding often good sized moves.
Excellent R/R.
I'm suprised at a 65% hit rate but as can be seen by the examples even a much lower hit rate would return good profit.

Do you have an M/S formulas which flushes these out?
 
Hi All

For a long time I've tried to find MS scans that will simply flush out these set ups .... to no avail. I buggerised aroung with ADX, swings, zig zag - just about everything. Its actually quicker just for me to look at all the charts with sufficient liquidity.

I have a daily and weekly routine that helps.

A - Filter all stocks with an average daily value greater than $300,000 for the past 50 days (As I now use CFD's I want at least this level of liquidity)

Then, from this subset

B - Show Big Whites - daily

Then same at end of week B - Show Big Whites - weekly.

This will at least flush out those stocks that performed...

Really as I'm really only interested in the top 10 - 15 % of the market this is 250 - 350 stocks. As the set up's I look for take weeks/months to form up as long as I look at each of these 250 - 350 once a month I see them form ... then I wait. If they don't behave and I delete them.

MOS, CUE, Oxiana, NDO, MCC, GDN (see separate post as this one moved a week or so ago) are current watchlist stocks. Then I make sure I'm comfortable with the FA position and all the announcements that are in the market.
 
Seems like a great strategy Dutchy,
Thanks for sharing.

You mention hit rate 65% (impressive), what about R/R ?
 
Hi Nizar

Always an issue for me. R/R if the position works is generally good. For example 10 -15% entry risk followed by 50%+ return. What I tend to do is (try) to stagger entries. By taking (say) a third on the entry day Close and the second third the following morning if the open is positive. Then the rest of the position in a day or two's time ...

Great in theory ... generally the best ones force me to chase the market, which is un-nerving, but tend to produce the better results in the end.

I used to follow the 2% of total capital rule ... only trouble is that I've found that if I get really aggressive with the ones that confirm powerfully early returns increase dramatically ... still I've also had some wicked reversals and paid a high price ... in all this is an area I could focus on more ...
 
Dutchy,

Nice strategy & Thanks for sharing on here...

Can I share a couple of observations....


1. Just off the chart to the left was the price in a downtrend prior to the set-up? If so, then this could be seen as a double / triple bottom.

2. I like your use of Volume to confirm the break-out.

3. You mention Risk:Reward. Do you have a minimum R:R and if so, how do you calculate in advance where you will exit the trade with profits?

4. The moving red line looks like a specific MA. If so, what value do you use, on what time frame do you look at it, and do you also look for the SP to rise above it before entering the trade?

ie Using it as a confirmation tool to trade in the direction of the main trend?


Thanks in advance,

Chorlton
 
1. Just off the chart to the left was the price in a downtrend prior to the set-up? If so, then this could be seen as a double / triple bottom.

OK

2. I like your use of Volume to confirm the break-out.

3. You mention Risk:Reward. Do you have a minimum R:R and if so, how do you calculate in advance where you will exit the trade with profits?

No ... I just follow the market ... where I do let myself down is not seeing a trend through to completion ... always looking for the next big one and leaving $ on the table

4. The moving red line looks like a specific MA. If so, what value do you use, on what time frame do you look at it, and do you also look for the SP to rise above it before entering the trade?

30 ... and the SP will always be above this when I enter ... regardless if daily or weekly

ie Using it as a confirmation tool to trade in the direction of the main trend?
 
How does this qualify Dutchy?
 

Attachments

  • PBD.gif
    PBD.gif
    11.1 KB · Views: 682
PDN

PDN is in a descending triangle and looks like it will be there until late June. Unless a breakout occurs, current sentiment may not lend it self to that view, but definately some energy being built up in there.
 

Attachments

  • PDN 21.jpg
    PDN 21.jpg
    52 KB · Views: 633
Status
Not open for further replies.
Top