Australian (ASX) Stock Market Forum

The Wyckoff Method

Joined
4 March 2007
Posts
1,366
Reactions
4
I have had a few PM's asking about the Wyckoff Method

I have not had time to give them a proper ( useful response )

So I thought I would just start this thread to at least post a few resources ...

On this page is a link to the first 5 pages of unit 1 ( Yes the introduction is still available, It is unit 1 .. Though it is really much more than an introduction )

http://tradingsuccess.com/blog/richard-wyckoff-iii-104.html

here is the link itself

http://www.tradingsuccess.com/pdf-pub/wyckoff.zip

Here is the website of Wyckoff-SMI

http://wyckoffstockmarketinstitute.com/corner.htm

It is one of the pages with some info on the 5 steps ( 3 so far )
This website is only recently new

I don't know if SMI have ever had a web site before now.

It also seems to be still being step up.


Wyckoff's first writings on his method started approx 1907.

Significant and influential... Was studies in tape reading ( 1908 & 1910 )

His work culminated in "Stock Market Science" and the setting up of the SMI in 1931.
Which has continued to operate and enhance the material.

A start for those interested

http://www.moneymaximizer.com/pdf/MTA_Journal_Issue_43_Forte.pdf

http://www.moneymaximizer.com/pdf/MTA_Journal_Issue_44_Coppola.pdf

http://www.tsaasf.org/images/stories/newsletters/tsaa newsletter spring 2001.pdf

http://www.hankpruden.com/MTWyckoffSchematics.pdf

http://www.tsaasf.org/images/stories/newsletters/tsaa newsletter summer 2001.pdf

......................

http://www.hal-pc.org/~tradesig/presentations/2007-10.pps

This is a power point presentation... It is related to this topic
( it is about cobweb oscillations )

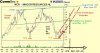
Price , volume time & position are used by Wyckoff

To measure the shifting and rotation
of Demand and Supply curves.

To identify "Cause"

Behaviour and Change of Behavior

each move has a

--Certain price range
--A quantity of volume traded
and
--Take a certain amount of time ( this is duration )
--Have a start and end . This is the context of position.


Principles of Demand and Supply

motorway
 
Hi Julius,

I will jump in here briefly if I may as I am a user of Wyckoff analysis on an intraday basis in my trading. I wont presume to speak for Motorway, not will I presume to say that what I do is even correct application of Wyckoff. I have learnt Wyckoff with Motorway's direction, from his many posts on the matter and pm between us. Whether I have learnt, and apply, it properly is another matter entirely and is my responsibility!

The way I apply Wyckoff analysis is in the principles he speaks of, applied to the market I trade. I make this point because it is not as if you can learn some nifty "set ups" (buy when the blue line crosses the red line type stuff) and away you go - no, using Wyckoff is more about understanding what is going on in the market (i.e. with the price & volume within time). The aim of Wyckoff analysis is a low-risk entry point to capture a move that is is going to happen imminently. Always there is risk, so always there is a stop loss. Wyckoff analysis can also be used for exits (stop placement and profit-take price) although I must admit I am not this far advanced ... I can see where to place a logical stop with Wyckoff but am placing targets for my profit exits. This is a big area for improvement for me and is a work in progress.

Wyckoff speaks of the 3 laws:
1. Supply and Demand
2. Cause and Effect
3. Effort and Result

I use various tools (charts) to view these 3 laws. You ask to see "intraday demand/supply analysis ala Wyckoff" - understanding supply/demand is getting to grips with law 1 (above), and is done by also using laws 2 and 3.

I wont presume to instruct on how to understand and apply Wyckoff, but this is an idea of how I use it intraday.

Law 2 is Cause and Effect - that is a sustainable effect (price move) will only come from a Cause (a reason for the price move). To understand Cause and Effect it is necessary to understand the 4 stages of a market 'cycle': accumulation, mark-up, distribution and mark-down. A point and figure chart is a good tool for viewing these stages.

The first chart shows Friday's trading (most of it) in the Emini S&P contract (the "ES"). Circled areas are areas that show accumulation taking place. After accumulation you would expect the mark-up phase. (Just to re-iterate, any mistakes in application and understanding are entirely mine). Accumulation is demand overcoming supply.

attachment.php


Law 3 is Effort and Result. You may have seen some of the posts on the board referring to VSA analysis, tech/a has posted much info on this. Much of VSA is related to effort/result. Basically it is looking at how price interacts with volume behaviour and again can be used to ascertain probable demand and supply. For effort/result a 'vertical' chart is most readily used, such as a bar chart or candlestick chart (bar charts are the preferred tool of Wyckoff analysts, the 'open' is not deemed to be of any relevance (what does 'open' and 'close' mean on an intraday bar anyway? ... Not a rhetorical question).

attachment.php


Chart 2 shows some of Friday's ES trading on a 3-minute candle chart. I have highlighted a bar which shows huge volume and might well be termed as a climactic sell. At the time this bar formed you would be alert to the potential for a reverse in the downtrend (demand overcoming supply). Note that all we got was a sideways move for a few bars before another move down. This where the P&F chart can qualify the bar chart, the P&F showed no accumulation (I speak here with hindsight of course ... when you are live at the right edge it is more difficult and is where being disciplined and sure of your application of principles is important). Of course this is just one chart of many possible - there are many times, especially in the ES where a much shorter timeframe chart is of more value (well, to me anyway). And who is to say that a bar based on time divisions is th best anyway?

Chart 3 I have highlighted another role of effort/result, looking for continuation in the trend, the dots above the bars highlight one method of entry into the trend (these bars highlight the prevalence of supply over demand, what we want in a downtrend for it to continue). Also on chart 3 is a bar highlighted at the bottom of the downtrend with an "X". In effort/result terms it is very important. It is also important in Wyckoff terms as it shows clear "Change of Behaviour".

attachment.php


Obviously, there is much, much more to Wyckoff than what I have shown here, but I hope it gives you a view of how it may be used on an intra-day basis.
 

Attachments

  • w1.jpg
    w1.jpg
    144.9 KB · Views: 2,128
  • w2.jpg
    w2.jpg
    109.5 KB · Views: 2,089
  • w3.jpg
    w3.jpg
    111 KB · Views: 2,031
Also Julius, the Point and Figure chart I put in the above post uses a 1 box reversal. Much of Wyckoff analysis uses a 3 box reversal in addition to the 1 box. My using the 1 box reversal says a lot about my approach to trading and the magnitudes of moves I am trading.

attachment.php


This chart shows a 3 box reversal of the same day. This is also applicable to intra-day trading, but for those looking for a move of a greater magnitude, on a different scale, to what I am doing in my trading. Note the boxed area is accumulation on this different scale, followed by a "Spring" move, another Wyckoff principle.

Following are three areas of "re-accumulation" in the mark-up after the spring, all circled.
 

Attachments

  • w4.jpg
    w4.jpg
    151 KB · Views: 2,010
Timmy you've come a long way.Good stuff---always good to post up instruction helps consolidate your learning.

Those P&F charts have some fantastic "Darvas" type boxes in moves.
 
timmy,

Cheers for putting the time into your reply, I've been wanting to see wyckoff applied intraday for a while.

I use range bars for day trading and will admit volume forms no real part of my analysis - not that I think it couldn't be done, but currently I focus purely on price. lately I've been tracking range wrt. time but thats for another thread.

My only question is whether volume was a necessary component in the examples you provided - what changes if you weren't looking at the volume?
 
Volume relates esp to what Wyckoff calls "character"
Price is related in a larger degree to what he calls "appearance"

( The P&F is to be understood as being woven by Price volume & time and Wyckoff P&F is understood more like "market profile" than what most people think of when they think of P&F )

Volume and Price can be

harmonious -- moving together at similar speed
inharmonious -- moving at different speeds

( eg the example given in the 5 pages of introduction )


Abnormally large and swift volume expansion marks a turning
point - either temporary or permanent.


volume represents the action of those who are followed

Wyckoff Principle of the Composite Man ( or Operator )

Volume is the other side coming in
demand starting to meet supply
supply starting to meet demand

Before price bottoms in a down trend
There will often be "Preliminary support" showing up

volume and price will start to get inharmonious...

At the time this bar formed you would be alert to the potential for a reverse in the downtrend (demand overcoming supply). Note that all we got was a sideways move for a few bars before another move down.

Tim's comment on his chart...........Tim was on alert , because accumulation was likely underway ALREADY....

The principle of Preliminary support was judged to be occurring..

The study of responses ... is an almost unerring guide to the technical position of the market."
- Rollo Tape (Richard Wyckoff

every action is a test and a response...........

With PS identified some sort of ending action is anticipated as a response

Selling climax ...again defined by "effort and result"

anticipates an automatic rally.... is that rally the response strong or weak ?

ie ... in terms of price range, volume, duration and position.

Secondary test

an accumulation phase identified as starting at Preliminary support
is unfolding...

Without the price volume principles
A trading range could be
accumulation distribution
or nothing

Identifying price volume principles

Accumulation will see signs of strength SOS and last point of support

The Wyckoff terms relate to the price volume character
and not just the appearance of price...

The principle of preliminary support...is Price and volume becoming inharmonious... The principle of a "Sign of strength" is price and volume in harmony and becoming more "urgent"

Demand and supply involves gauging price movement ( thrusts duration retrace etc )
effort and result involves the "character" of that price movement.

Where the Volume ( THE OTHER SIDE ) comes in or is starting to come in

Cause and Effect

is about what is the reason those holding have for holding
strong or weak hands

"It won't go up until after you sell"

ie until reasons for holding change

wyckoff gives emphasis

To Price movement
volume & Time

not just price
not just volume

motorway
 
Tech/a - thanks very much for the kind words. WRT Darvas, it might be difficult to come up with a style of chart more suited to Darvas than P&F; in its construction P&F acts a filter on the price itself and as a filter on the price movements. Wyckoff analysis focues on very different things to Darvas, but the P&F could serve both very well.

Julius, Motorway's reply to your point re volume says it all really. For my part if I was to split up the relative importance I place on assessing the volume moves compared to the price moves I would put it at 50:50. The two, for me, are inseparable. Also, if I see a price move without what I expect in the way of a volume move I will side with my volume assessment, I will call that price move "wrong" (thats not the right word, I think Motorway's distinction between appearance and character are the right words) and expect the price to retrace the "wrong" move. Maybe thats where the term "correction" comes from?

Julius, a question if I may - what instrument(s) are you day trading?

Motorway - your post in reply (#7) is rich in meaning thank-you. Maybe it is because I have been studying this stuff for a while now but that post in itself has turned on more lightbulbs for me.
 
My only question is whether volume was a necessary component in the examples you provided - what changes if you weren't looking at the volume?

Julius, once again I fail to answer the question asked!

In the candle chart where I have placed a dot above bars I have termed provide a strong signal of continuation it is the volume on these bars that provide the alert. Each of these bars has an upper shadow (I don't think I will ever not use candlestick terminology) - this is "test" to take the pricie higher. Each of these tests is on low relative volume (a good definition of low relative volume is volume lower than the prior two bars). Each of these bars too gives a response to the test in itself - they all tried to go up (demand) but failed. Note the final bar I have marked didn't then go down much ... this is an important indication in itself.

Also, I try not to read each bar individually, rather I will try to assess the 'wave' (a series of bars) as a whole.

Also, note how the volume jumps before and near the termination of the down move, this is a clear warning to me; note what Motorway says about volume change like this:
"Abnormally large and swift volume expansion marks a turning
point - either temporary or permanent."
 
timmy i trade SPI futures and I follow the YM & ES

I can see the volume that corresponds with your analysis but I guess I am curious to see it incorporated into a trading set up in real time - in other words, is the price volume relationship significant enough to be tradeable on a real time intraday basis

Completely agree with your point in regards to price movement wrt. volume and retracements - in practise im more aware of this in terms of time vs price movement, but the temporary drop in liquidity is the real cause, as i've said on another thread I think.

look forward to more from both of you - food for thought
 
Motorway - your post in reply (#7) is rich in meaning thank-you. Maybe it is because I have been studying this stuff for a while now but that post in itself has turned on more lightbulbs for me.

I also got a lot out of this post just like most of your posts M/W, but it sometimes takes awhile for things to sink in properly.:eek: The more I study the better understanding I get of some of the things you are saying.

The way I apply Wyckoff analysis is in the principles he speaks of, applied to the market I trade. I make this point because it is not as if you can learn some nifty "set ups" (buy when the blue line crosses the red line type stuff) and away you go - no, using Wyckoff is more about understanding what is going on in the market (i.e. with the price & volume within time). The aim of Wyckoff analysis is a low-risk entry point to capture a move that is is going to happen imminently. Always there is risk, so always there is a stop loss.

This is an important point.

It took me a while to get my head around this (due to being programmed to look for patterns etc for trade set ups without understanding the patterns character), Wyckoff isn't about patterns or "buy or sell" set ups. I have found that while the Wyckoff principles are very simple, the application (your favourite word Tech) and true & deep understanding of the principles & method (like M/W) require alot of study and hard work.

Keep it coming Timmy and M/W always enjoy your posts and am constantly learning from them, even your old ones.
 
Great thread on Wyckoff guys, keep it up. Thanks a million for those links to the articles motorway and for your tutes.....and to you too timmy for the charts and detailed explanations.
 
In the Wyckoff Course, Wyckoff teaches that the most important thing anyone can know about a market or an individual issue is its trend and the position that it occupies in the trend. The trend is the line of least resistance. It indicates the direction in which the price wants to move. Profits are more likely to be realized when positions are established that are in harmony with the direction in which the price has already indicated it wants to move.
http://www.wyckoffstockmarketinstitute.com/wyckoff_step1.htm


Trend and Position in the trend..

Trend = The Line of Least Resistance = the direction in which the price wants to move


At it's most immediate the Line of least resistance is simply , where is down hill !

Not in the sense of price moving down..........But in the sense of a price series moving with EASE..

The line of least resistance is always ( in this sense ) down hill..

It is effortless..........it needs no impulse........
eg water simply RUNS down hill...

The Trend is determined by observing where the "Ease of Movement" occurs

DOWN , UP OR SIDEWAYS

eg higher highs higher lows ?
or
lower lows lower highs ?


What is the spacing on the bars ?
which direction congests . where do they overlap ?

Where are the closes ?

what about duration ?

on the figure chart.......where are the water falls ?
Where is the congestion ?

EOM (ease of movement) should jump out at you with clarity.

To be used effectively, trends must be defined correctly. Wyckoff tells us that trends are defined by two consecutive support points or resistance points of equal importance.

These lines are not used to trade mechanically from.
They are frames of context... They are straight edges . The position of which are defined by the action of the stock and nothing else...

They are not like a moving average that have a time frame .

A trend is the line of least resistance It is where the ease of movement is --------------------->The next few tics or a 1000% move.

Down Hill however does not last for ever..
At some point the behavior will change...COB ...Change of behavior

DEMAND & SUPPLY
CAUSE & EFFECT
EFFORT vs RESULT


motorway
 

Attachments

  • CNP 6 mar.gif
    CNP 6 mar.gif
    28.6 KB · Views: 373
  • CNP 6mar.gif
    CNP 6mar.gif
    23.6 KB · Views: 357
So would Wycoff Method agree that MCR is in the bottom of a progressively higher peaking and higher support level cycle that could see my predictions come good? and is the path of least resistance upward with a spiking nickel price?
 

Attachments

  • MCR Macro Cycle.jpg
    MCR Macro Cycle.jpg
    56.4 KB · Views: 354
Just found this thread.:2twocents I bought the SMI course some 10 years ago. Three thick binders worth of instructions and lessons back then. Started with it but you had to be terminally anally retentive to progress to completion imo. Not for the faint-hearted imo:eek: Read some of his books instead; found his ideas helpful and a good basis for a sector-based trading strategy for the long term. I found his book "How I Trade and Invest in Stocks and Bonds" (Fraser Publishing reprint) quite a good read.

jmo dyor
 
MCR.

Looks un likely to progress much further to the long side.

MCRTG.gif

Watch for price action at these levels in the "Playing field" a break out of it would be weak.

Elliott sees this is a wave 4 with a wave 5 to complete.
Anything on the long side is against the trend.

MCRGet.gif
 
So would Wycoff Method agree that MCR is in the bottom of a progressively higher peaking and higher support level cycle that could see my predictions come good? and is the path of least resistance upward with a spiking nickel price?

I will try and post a chart later

Just found this thread.:2twocents I bought the SMI course some 10 years ago. Three thick binders worth of instructions and lessons back then. Started with it but you had to be terminally anally retentive to progress to completion imo. Not for the faint-hearted imo:eek: Read some of his books instead; found his ideas helpful and a good basis for a sector-based trading strategy for the long term. I found his book "How I Trade and Invest in Stocks and Bonds" (Fraser Publishing reprint) quite a good read.

jmo dyor

I have found it amazing stuff


All His books are good ,,,, But it is Stock market Science that is where he

offering the cream of what I have learned in forty years of active experience in Wall Street.
By the methods herein explained, I have made a great deal of money for myself and my clients and subscribers who numbered in excess of 200,000. By
making this available to those who desire to learn the business of trading and investing in stocks -- for it is a business just like law, medicine or any
other -- I hope to be of still greater service, not only to my former patrons, but to others who have not had an opportunity to invest under favorable conditions.
You can learn from this how to develop independent judgment, so that you need never ask anyone’s opinion or listen to anyone’s tips, or take anybody’s advice. You can so train your judgment that you will know just what to do and when to do it. When you are in doubt you will do nothing.


It is this course that masters of the markets study..


Elliott sees this is a wave 4 with a wave 5 to complete.
Anything on the long side is against the trend.

An important Wyckoff Princple is the Composite Man ( or Operator )

The CM transfers risk in return for reward,,

Markets go up in bubbles so people max out on debt and take on all the risk
They then crash into bear market lows where they then transfer all the future reward.


The idea of smart money is an aspect of the Composite Man.
The CM draws the columns on the figure chart..

And uses every known and unknown methodology for his purpose..

That is he uses the liquidity that those methodologies generate.

His purpose is to transfer risk to YOU and take the rewards
It is what financial markets do...Or what people allow them to do :)


Richard D Wyckoff Went to work in Wall Street in 1888
when the entire list of the transactions of the exchange for a whole YEAR could be shown in less than one two inch column..

There was no TA or even FA there was just inside knowledge
manipulation tips and rumors.........and tape readers.


doogie_goes_off............In a wyckoff sense... You look for the principles
You don't look for bargains... Identify Principles ...


The thread is about the Wyckoff Method for those interested..
It is not about anything else.. It is certainly not about motorway :)


motorway
 
Hi Motorway,

At the risk of getting a very prominent placing on the list of the "Usual Suspects" that respond to your posts, thank-you very much for these latest additions.

There is a lot of talk on this board and in the media about aggressive short-selling, mainly from offshore hedge funds, so profiting from the recent falls, and perhaps (most likely) even contributing to them. (I don't want to start a debate on this point, plenty of threads, one could even say bolts of fabric, devoted to this at the moment). Looking at this short-selling from the perspective of the Wyckoff model you would say these short-selling interests were representative of the Composite Man (or Composite Operator if you prefer) in action.

I believe, my 'job' in participating in the market is to make money. In order to do this I need to limit my risk and seize opportunity. By having a model in place (the Wyckoff method), and correctly applying the methodology of this model, I can uncover the activities of the CM/CO and coat-tail these activities. It is a very powerful method.
 
~~
The thread is about the Wyckoff Method for those interested..
It is not about anything else.. It is certainly not about motorway :)
motorway

I deservers to be, I don't think I will ever think of the Wyckoff Method without reflecting on your teachings.
 
Okay I thought I'd post up this chart of CEY that I've been using to get a better understanding of some of the Wyckoff princples involved in the accumulation and mark up phases.

While this is a hindsight view of CEY I have found it very helpful in learning to identify accumulation in other stocks.

Also remember just because you can identify a trading range with a SC, AR, ST etc doesn't mean it's accumulation - it could also be distribution or even nothing. It's about the character and substance of the TR not the "pattern".

A few things about the chart. (Please note this is a chart before the $1.88 capital return to holders and is also a couple of months old)

The possible buy zones marked are put there in hindsight and obviously would be harder to identify when trading "live", also they are only buy zone areas where you would be looking at getting into the stock after you have identified acc going on and have established some support and resistance zones.
The interaction between price and vol also provide alot of insight to this TR. Where does the vol come in and what is the effect that vol has?
I find this chart helped me greatly to understand the 3 laws of Wyckoff as they are all on this chart.
DEMAND & SUPPLY
CAUSE & EFFECT
EFFORT vs RESULT

I was in this stock at around $2.70 shortly after the SC marked on the chart, but I was bored/scared out of this stock a few months later for a very tiny profit(hence my sig) :eek::banghead:. But I didn't know anything about Wyckoff or much about trading in general then, boy do I wish I had though. Ah well you live and you learn:D.

One last thing, as eieio stated this method is not for the faint hearted and requires alot of study, time & effort (read hard work) to understand its principles (I'm only just begining my journey), hence why it's probably not as popular as it should be. Like MW and Timmy have stated, I also find it an amazing eye opener and a very powerful method.
 

Attachments

  • cey TR.png
    cey TR.png
    27.1 KB · Views: 326
Top