This is a mobile optimized page that loads fast, if you want to load the real page, click this text.

If you are in net positive inflow, would you want prices to be determined only by those who can buy/hold (causing upwards bias), or would you prefer the market to reflect a more complete balance of buyers and sellers? If the short sellers push the prices down unreasonably, their long only active managers are in a position to spot it and capitalise on it. If it is having a gross impact on an entire market, their asset allocators will step in.
If you like a stock, buy in, lend it, and the short seller pushes the price down...aren't you happy to have the opportunity to buy the burger you like at a lower price?
The key problem with the shorts is that they can break a market. Malicious shorting can put an otherwise healthy company into difficulties simply by tightening its financial conditions. We have seen such actions in the banking stocks in the GFC. We also see it in currency markets when a country becomes distressed, for example.
Super funds can always recall their stocks on loan. It often happens when the stock is in some special situation. Governments have stepped in to ban short selling where this has become unhealthy.
Overall, the funds hold pretty much the index. If the shorts want to pay borrow and help defray the cost of administering a super fund whilst helping to avoid long-side bubbles and generally helping to price stuff more accurately by adding selling pressure as needed, why not. From time to time, this will be unhealthy. That is the case with financial markets in general too, even without short selling. On balance, it's likely to be net beneficial for the super funds in aggregate.

Thanks for taking the time to write this up Deepstate. Having only been a systematic trend trader for 3 years, current prolonged volatility and price action is unusual against the "history" I've experienced. 2011 and 2008 only recent guideposts to compare (where VIX has spiked up but not trended down over coming weeks).
Technically, I'm still inclined to be a long term optimist as per crafts XAO accumulation graphs.
Valuable insights there on the benefits and effects of large scale shorting.
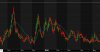
Example of VIX spiking, with "settling" downward trend (2015 VIX Daily):

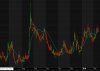
Recent VIX daily, with large spike followed by UPWARDS trend:

I think since 2007 to now (~8.5 years), the period between mid 2012 to mid 2015 were the unusual periods - a lack of volatility and a lack of significant pull back... 2014 was significantly boring market-wise.
Between 2008 to 2012, there was an "end of the system" threat almost every year. Looks like we could be returning to those times.
Whether any of these threats turn out to be the real big one... who knows? Kind of like living in an Earthquake zone I guess.
Why?
Both mining and manufacturing only represent approx. 7% each of National output. The currency is also at play absorbing some of the downturn in these two trade exposed industries. To some extent Aus suffers from the "Dutch Disease" when commodities are booming - what about the recovery from that?
And there we have it. A nice bullish false break.

I'm not worthy - please explain more TH. (please ignore Wayne's World reference)
Wouldn't the bearish pushes on that graph look just as bullish if flipped?
If I looked at that flipped, I would be wondering what's holding it back? Two clear breaks now above consolidation yet it hasn't got on with it.
Flip it back - what's holding it up? how much clearer technical signal does it need to get on with the job and find a lower trading range if it actually wants to go there?
The context for this thread was reasonable valuations for Aus equities, given that context false breaks or even a weak down trend has meaning for me.
Without putting words in the mans mouth, I believe TH is only saying that in his opinion (which one would often lose money ignoring), future returns of the right hand example will generally be more certain than future returns of the left hand example.
TH is much more a fan of "fading" (betting against) a breakout than going along with it and these days the anticipation that many breakouts end up as "false breaks" (i.e. right hand example) usually is correct.

My view from the Technical side is that in both price/percentage and time the market has not come back far enough in my opinion.
I believe we are in a C wave and from this perspective am expecting the market to still come back towards 4500 towards the end of the year.
Although I must say that it has been holding up well around the 5000 level on any pullback.

What's the value area if zoomed in?
Thanks CanaAussieUK.
What do you mean sorry?
I was just wanting to see what it looked like when the volume-at-price is set per month, for example. Zoomed in to the last year or so.
DeepState
Multi-Strategy, Quant and Fundamental
- Joined
- 30 March 2014
- Posts
- 1,615
- Reactions
- 81
What are people's thoughts on the readiness of super funds to lend shares to shorters?
If you are in net positive inflow, would you want prices to be determined only by those who can buy/hold (causing upwards bias), or would you prefer the market to reflect a more complete balance of buyers and sellers? If the short sellers push the prices down unreasonably, their long only active managers are in a position to spot it and capitalise on it. If it is having a gross impact on an entire market, their asset allocators will step in.
If you like a stock, buy in, lend it, and the short seller pushes the price down...aren't you happy to have the opportunity to buy the burger you like at a lower price?
The key problem with the shorts is that they can break a market. Malicious shorting can put an otherwise healthy company into difficulties simply by tightening its financial conditions. We have seen such actions in the banking stocks in the GFC. We also see it in currency markets when a country becomes distressed, for example.
Super funds can always recall their stocks on loan. It often happens when the stock is in some special situation. Governments have stepped in to ban short selling where this has become unhealthy.
Overall, the funds hold pretty much the index. If the shorts want to pay borrow and help defray the cost of administering a super fund whilst helping to avoid long-side bubbles and generally helping to price stuff more accurately by adding selling pressure as needed, why not. From time to time, this will be unhealthy. That is the case with financial markets in general too, even without short selling. On balance, it's likely to be net beneficial for the super funds in aggregate.
- Joined
- 17 October 2012
- Posts
- 707
- Reactions
- 1,389
If you are in net positive inflow, would you want prices to be determined only by those who can buy/hold (causing upwards bias), or would you prefer the market to reflect a more complete balance of buyers and sellers? If the short sellers push the prices down unreasonably, their long only active managers are in a position to spot it and capitalise on it. If it is having a gross impact on an entire market, their asset allocators will step in.
If you like a stock, buy in, lend it, and the short seller pushes the price down...aren't you happy to have the opportunity to buy the burger you like at a lower price?
The key problem with the shorts is that they can break a market. Malicious shorting can put an otherwise healthy company into difficulties simply by tightening its financial conditions. We have seen such actions in the banking stocks in the GFC. We also see it in currency markets when a country becomes distressed, for example.
Super funds can always recall their stocks on loan. It often happens when the stock is in some special situation. Governments have stepped in to ban short selling where this has become unhealthy.
Overall, the funds hold pretty much the index. If the shorts want to pay borrow and help defray the cost of administering a super fund whilst helping to avoid long-side bubbles and generally helping to price stuff more accurately by adding selling pressure as needed, why not. From time to time, this will be unhealthy. That is the case with financial markets in general too, even without short selling. On balance, it's likely to be net beneficial for the super funds in aggregate.
Thanks for taking the time to write this up Deepstate. Having only been a systematic trend trader for 3 years, current prolonged volatility and price action is unusual against the "history" I've experienced. 2011 and 2008 only recent guideposts to compare (where VIX has spiked up but not trended down over coming weeks).
Technically, I'm still inclined to be a long term optimist as per crafts XAO accumulation graphs.
Valuable insights there on the benefits and effects of large scale shorting.
Example of VIX spiking, with "settling" downward trend (2015 VIX Daily):
Recent VIX daily, with large spike followed by UPWARDS trend:
skc
Goldmember
- Joined
- 12 August 2008
- Posts
- 8,277
- Reactions
- 329
Thanks for taking the time to write this up Deepstate. Having only been a systematic trend trader for 3 years, current prolonged volatility and price action is unusual against the "history" I've experienced. 2011 and 2008 only recent guideposts to compare (where VIX has spiked up but not trended down over coming weeks).
I think since 2007 to now (~8.5 years), the period between mid 2012 to mid 2015 were the unusual periods - a lack of volatility and a lack of significant pull back... 2014 was significantly boring market-wise.
Between 2008 to 2012, there was an "end of the system" threat almost every year. Looks like we could be returning to those times.
Whether any of these threats turn out to be the real big one... who knows? Kind of like living in an Earthquake zone I guess.
If you look the pattern of trend of the XAO when it's finished the most logical result is a pattern that looks like either oil or BHP ATM...
Why?
Both mining and manufacturing only represent approx. 7% each of National output. The currency is also at play absorbing some of the downturn in these two trade exposed industries. To some extent Aus suffers from the "Dutch Disease" when commodities are booming - what about the recovery from that?
Trembling Hand
Can be found on the bid
- Joined
- 10 June 2007
- Posts
- 8,852
- Reactions
- 205
I like the setup. False breaks are more bullish than solid support IMO.Yesterday seems to put paid to that little ray of sunlight - wrong again.
And there we have it. A nice bullish false break.
- Joined
- 17 October 2012
- Posts
- 707
- Reactions
- 1,389
I like the setup. False breaks are more bullish than solid support IMO.
I'm not worthy - please explain more TH. (please ignore Wayne's World reference)
Wouldn't the bearish pushes on that graph look just as bullish if flipped?
I'm not worthy - please explain more TH. (please ignore Wayne's World reference)
Wouldn't the bearish pushes on that graph look just as bullish if flipped?
If I looked at that flipped, I would be wondering what's holding it back? Two clear breaks now above consolidation yet it hasn't got on with it.
Flip it back - what's holding it up? how much clearer technical signal does it need to get on with the job and find a lower trading range if it actually wants to go there?
The context for this thread was reasonable valuations for Aus equities, given that context false breaks or even a weak down trend has meaning for me.
I'm not worthy - please explain more TH. (please ignore Wayne's World reference)
Wouldn't the bearish pushes on that graph look just as bullish if flipped?
Without putting words in the mans mouth, I believe TH is only saying that in his opinion (which one would often lose money ignoring), future returns of the right hand example will generally be more certain than future returns of the left hand example.
TH is much more a fan of "fading" (betting against) a breakout than going along with it and these days the anticipation that many breakouts end up as "false breaks" (i.e. right hand example) usually is correct.
- Joined
- 13 January 2011
- Posts
- 372
- Reactions
- 16
Ahh, but what if it's a 'false ''false'' ' break out? That is, it 'false 'breaks below, bullish week or two to draw in buyers (say to 5100-5200), only to fail again and get slammed down to 4500-4600.
It seems both the ASX and S&P are range bound, just enough to stop traders out or get them to cover.
It seems both the ASX and S&P are range bound, just enough to stop traders out or get them to cover.
- Joined
- 29 August 2014
- Posts
- 500
- Reactions
- 72
Yeah it looks like it PP, until the hysteria clears over world banks I feel that is how things are going to roll
quick thought to the original post, given the introduction of superannuation and the forced inceased inflows into equities via default "Balanced" Plans, would the long term xao trend line then be somewhat distorted then otherwise dictated by just the market ?
probably wont make a diff unless a case can be made that super is going away, but I was just wondering if a significant distortion was introduced and as the trend illustrated is somewhat "straight", that if super was not introduced the end part of that trend should be "Bent" Lower then it currently is (Ie more purely subjected to market forces).
probably wont make a diff unless a case can be made that super is going away, but I was just wondering if a significant distortion was introduced and as the trend illustrated is somewhat "straight", that if super was not introduced the end part of that trend should be "Bent" Lower then it currently is (Ie more purely subjected to market forces).
Bump
Maybe the XAO Bull concept might get a little more sympathy with a bit of traction under the belt.
What's next? Range? Smash back to new lows? new post GFC high? Nothing has really changed in my mind to move my value zone from around 5000 but I don't know what the market will do in the short term - What do you all think? What do the charts say?
CanOz
Home runs feel good, but base hits pay bills!
- Joined
- 11 July 2006
- Posts
- 11,543
- Reactions
- 519
I'll participate with charts tomorrow!
Triathlete
Keep it Simple..!
- Joined
- 10 November 2014
- Posts
- 638
- Reactions
- 88
Bump
Maybe the XAO Bull concept might get a little more sympathy with a bit of traction under the belt.
What's next? Range? Smash back to new lows? new post GFC high? Nothing has really changed in my mind to move my value zone from around 5000 but I don't know what the market will do in the short term - What do you all think? What do the charts say?
View attachment 66516
My view from the Technical side is that in both price/percentage and time the market has not come back far enough in my opinion.
I believe we are in a C wave and from this perspective am expecting the market to still come back towards 4500 towards the end of the year.
Although I must say that it has been holding up well around the 5000 level on any pullback.
CanOz
Home runs feel good, but base hits pay bills!
- Joined
- 11 July 2006
- Posts
- 11,543
- Reactions
- 519
First the SPI.
SPI200 (XJO Futures)
I have highlighted the main value area. I suspect we'll run-out of steam soon at the 5384-5403 area. If we do not find sellers there, then i would target 5440 for sellers. If we can consolidate at 5440, this would be a very positive sign for a move higher....However if this area gets firmly rejected, along with 5400, then we could be headed to the lower side of the value area, 3500. We should be able to see this play out in the next few weeks because we are relatively close to those levels now.
Attachments
CanOz
Home runs feel good, but base hits pay bills!
- Joined
- 11 July 2006
- Posts
- 11,543
- Reactions
- 519
The XAO
The main value area is from 4000-5700
If we do not find sellers at the high now (5415) then we should push higher where we could find sellers 5530. Above 5640 and particularly 5712 and we could challenge the highs. However, if we start to see a topping pattern at these levels then i would expect a move back to 5000, and lower if that did not attract buyers.
Attachments
- Joined
- 30 June 2007
- Posts
- 7,200
- Reactions
- 1,228
The XAO
The main value area is from 4000-5700
If we do not find sellers at the high now (5415) then we should push higher where we could find sellers 5530. Above 5640 and particularly 5712 and we could challenge the highs. However, if we start to see a topping pattern at these levels then i would expect a move back to 5000, and lower if that did not attract buyers.
What's the value area if zoomed in?
Thanks CanaAussieUK.
CanOz
Home runs feel good, but base hits pay bills!
- Joined
- 11 July 2006
- Posts
- 11,543
- Reactions
- 519
What's the value area if zoomed in?
Thanks CanaAussieUK.
What do you mean sorry?
- Joined
- 30 June 2007
- Posts
- 7,200
- Reactions
- 1,228
What do you mean sorry?
I was just wanting to see what it looked like when the volume-at-price is set per month, for example. Zoomed in to the last year or so.