Australian (ASX) Stock Market Forum

Where is the XAO going from here?

Where do you think the XAO will be trading in the next few months?

  • Below 4000

    Votes: 11 34.4%
  • 4000 - 5000

    Votes: 17 53.1%
  • 5000 - 6000

    Votes: 3 9.4%
  • Above 6000

    Votes: 1 3.1%

  • Total voters
    32
Hi esky...
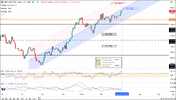
Depends on which Sell Zone you are looking at..

The current SP is WAY ABOVE the BCF Sell Zone....
The Current SP is not yet within the Linear Regression Sell Zone....
So any TA right now, this instant would be governed by the CCI & DMI & MFI Indicators, BUT they are giving mixed signals...
So Next we would look at MOMENTUM, and Todays Candle, so far, suggests Loss of Momentum...

Tomorrows Candle will be crucial in determining the XJO's next move..
1709521078559.png
 
Thanks, Doc.

As I walked away to clear my mind, thought I should be concentrating on the micro bits, trend of individual stocks instead.

For investors, the opposite is handy, eg, the direction of the All Ords. Not saying that this isn't important....just less so
 
Not to sure on what to make of this chart with some Indicators, such as ( Balance of Power ) which has spiked inline with the long neck candle, that tells me the bulls are in control. ( Chande Momentum ) is riding high. ( Majority Rule ) is riding the high also.

Just a quick observation on my chart, what you make of it is up to you. ..Or hears a thought is it bearish!

1709522174390.png

1709522535276.png
 
if I didn't think I new any better, it con jesting into into a break, or its going sideways, but tops preferred, I don't thinks its an error, although anythings possible. only time will tell, Interesting combustion for the week ahead.
Hi B..

Just looked at that Long Neck Chart of yours, Your Software provider produced that chart with the days Opening Trade of ZERO...
Thats impossible......
Just a Programming Error....
 
Last edited:
Hi B..

Just looked at that Long Neck Chart of yours, Your Software provider produced that chart with the days Opening Trade of ZERO...
Thats impossible.
Who'd of guessed it. Bit of a worry, I refreshed the chart only for it to look longer and worst. So I analysis ed a 30m chart and others to be normal. It only appears to be happening on the 1d & 1wk chart...

All Ords is down. I'm getting ripped!
 
Who'd of guessed it. Bit of a worry, I refreshed the chart only for it to look longer and worst. So I analysis ed a 30m chart and others to be normal. It only appears to be happening on the 1d & 1wk chart...

All Ords is down. I'm getting ripped!
You'll be right, so long as your trousers aren't ripped looking like a hula skirt.
 
Hi B..

Just looked at that Long Neck Chart of yours, Your Software provider produced that chart with the days Opening Trade of ZERO...
Thats impossible......
Just a Programming Error....
May I add that I have never heard of anyone ,apart from Bailxtrader, use the expression "Long Neck Chart" when discussing anything remotely related to the ASX or Share Trading in general... :wheniwasaboy:
 
May I add that I have never heard of anyone ,apart from Bailxtrader, use the expression "Long Neck Chart" when discussing anything remotely related to the ASX or Share Trading in general... :wheniwasaboy:
I may need some Valium Doc to address the issue of technical behavior of my chart yesterday and poor seanK having the same issues. I'm not that concerned it will cause a flaw. But causes a Long neck accordance with my trading and gives me issues with price action. You suggested that it may be " provider produced that chart with the days Opening Trade of ZERO..." But also like you said that " impossible."

The Valium will be nice, can per-scribe for my condition. On that note I would be confident and able to invest in selling the ASX 200 and All Ords for next couple of days due Divergence of the Valium and happy with Golds BO...

"Thanks for your time Dr...Have a nice day and don't get any Long Necks you may or may not need to have". :laugh:
 
Afore y'all take ya Valium for longneckedness and other ills curable only by homeopathy ...

My gut tells me the XAO is about to roll over and down.

Led by CBA and BHP imo.

Disclaimer : Any advice from gg's gut is purely accurate to the n'th degree and caution should be taken of infants and pregnant ladies in traffic both heavy and light.

gg
Not so sure, gg.

What intrigued me, while the All Ords dwaddles, BBOZ is doing the same thing. Had a look this morning at the BBOZ's depth before the market. Noticed that punters were selling, so they're expecting the market to go up from what I gathered. Commsec's depth looks very different to nabtrade's....matter of interest, here it is. Can also fit in BBOZ's thread.

The following is the current depth as I type, from nabtrade:

Market DepthLaunch in a new window
Market Detail
Buyers
QuantityPrice
Sellers
PriceQuantity
110Buyers
3,198,081Shares
175Sellers
3,588,086
 
Top