Australian (ASX) Stock Market Forum

Trading Divergence

Re: Reversal Swing Convergence Divergence

Thanks Eunza.
What I do note and wish to point out in all charts thrown up (including ALL) is there are many cases shown on the charts where there is divergence which has both succeeded and failed.
The addition of filters is an attempt to increase the reliability of an indicator which is often giving signals which equate to very little.

I note that Sinner sees a pullback within an up move as a successful divergence trade.(There are also some un successful ones on the charts presented.)

Pitty we dont have more than Eunzas charts to consider.

Hi Tech/A - The charts that I have posted today are shorter time charts - 30min / 2hr etc - This is just so I can easily insert the entry exit points.

However I do switch between timelines quite consistently. The shorter time lines are almost impossible to trade on their own -

If you compare the 1 day / 2day / 1 week charts RCD results to the shorter intraday charts these shorter ones show alot more movement that are cleaned / smoothed when set in a longer time frame. Usually the longer periods are more reliable however you want to also see the short term picture. (and so you don't have to wait until the candle closes)
 
Re: Reversal Swing Convergence Divergence

Yes I understand.
It does happen regularly on all timeframes.
But agree longer timeframes tend to have a larger footprint and as such eliminate some noise.
 
Re: Reversal Swing Convergence Divergence

Convergence and divergence in conjunction with a pattern reversal area or a level of support/resistance can be used to reinforce an opinion of a potential change of direction, or an end of current direction.
Other than that it is a case of which came first, the chicken or the egg.
(It was actually the chicken :D )
Just my :2twocents
.
 

Attachments

  • ALL 060810.png
    ALL 060810.png
    27.3 KB · Views: 4
  • IAU 060810.png
    IAU 060810.png
    54 KB · Views: 4
Re: Reversal Swing Convergence Divergence

Hi Professor,

You have labeled the divergence on the price extremes. Are you using the close price or price extreme as the points of price for the divergence?

Hi Snake,

I've used the extremes(lows) for the divergence. The white lines that were on the chart I posted were simply drawn on, the green arrows are what the software spat out at me after plotting the code I put together.

Cheers
 
Re: Reversal Swing Convergence Divergence

Question to those Testing divergence or have tested it.

I notice Prof's code uses LLV.

Metastock and others can use Peak and Trough codes.
I will show how both of these codes give false results in systems testing---but before I do I wonder if others use anything else?

Not the Oscillator but the method of identifying the 2 or more peaks or troughs in either price or oscillator.

This is very important to those who have used any of the above codes in testing.
Simply it wont be correct.
Demo later.
 
Re: Reversal Swing Convergence Divergence

When testing only the last swing will be taken.
I hope the charts shown make it clear to those who actually test.
If you do youll know exactly what I mean.
If you dont then be aware of the fact that many signals and trades which come along in R/T trading wont be found by code (algorithms) in systems tests.

Same thing happens when using Peak and trough Code to identify peaks and troughs but even worse.

Ive used with Profs permission his chart XAO and his code for the example.
 

Attachments

  • Exercise 3.gif
    Exercise 3.gif
    25.7 KB · Views: 1
  • Exercise 4.gif
    Exercise 4.gif
    25.1 KB · Views: 1
Re: Reversal Swing Convergence Divergence

When testing only the last swing will be taken.
I hope the charts shown make it clear to those who actually test.
If you do youll know exactly what I mean.
If you dont then be aware of the fact that many signals and trades which come along in R/T trading wont be found by code (algorithms) in systems tests.

Same thing happens when using Peak and trough Code to identify peaks and troughs but even worse.

Ive used with Profs permission his chart XAO and his code for the example.

Is there a data problem here? I have a higher low at the start of July, so no divergence:confused:

There is aproblem with my code, but having signals change as a move develops wasn't it(I just walked it through using bar replay and it spat out in real time exactly as it shows on the chart I highlighted). I would have thought that the above problem you described would have been the case if using zig zag, which is why I didn't use it(well that and the fact I wouldn't really know where to start with the zig zag!).

The code and chart I posted earlier showed the same divergence you said would disappear during May, but didn't show any in July, because there was none according to the code I wrote.

The main problem that my code will encounter is a lookback problem - if a low is printed that takes more than a month to break down to a new low, then the code won't pick up any divergence, as both the RSI and price hit new short term lows together when there is divergence over a longer period.

Attached chart shows what I'm talking about - it picked up the short term divergence based on the action in the blue box on the chart, but isn't capable of picking up what I highlighted with the 2 white lines due to it only looking back 20 bars.
 

Attachments

  • D3.png
    D3.png
    26.4 KB · Views: 1
Re: Reversal Swing Convergence Divergence

Morning.

Perhaps this will make it clearer.

If you search for a LLV,20 of anything today and something is at its LLV for the past 20 days it will be found.
If you run that same test tomorrow and the price has made a lower low then it will show it again on that lower low.
If you run the test the next day and price trades at another lower low then THAT low will be shown.
The initial low which was TRUE 2 days ago is now False.

SO WITH a SYSTEMS test the ONLY way the Algorithm of a LLV can be confirmed is (If using a 20 period condition) to wait until the NEXT 20 bars pass before printing the trade.

UNLESS you have a LATCH locking the FIRST occurrence of the condition you will be getting false results.

Anyway if this doesn't help ----- you may wish to re visit this post when you realize your R/T trading isn't emulating your systems testing (Meaning anyone who trades off self designed systems.)----

oh dear we are starting go around in circles. I mustn't have made myself clear so I'll highlight the important part of the post I previously made:

I just walked it through using bar replay and it spat out in real time exactly as it shows on the chart I highlighted.

The code I posted up doesn't look forward.
 
Re: Reversal Swing Convergence Divergence

oh dear we are starting go around in circles. I mustn't have made myself clear so I'll highlight the important part of the post I previously made:


The code I posted up doesn't look forward.

Ok---
 
Re: Reversal Swing Convergence Divergence

Hi Guys,

A few updates for today - each subsequent ASX Code has been posted in the appropriate thread.

DUE - looking bearish.
OGC - looking a little mixed - might be a possible reentry on short term strength
SGN - Looking very strong on intraday, daily and weekly (will post a screen of the weekly soon if i get a chance)
 
Reading though my brokers notes this morning, and came across this, an Interesting look at Divergence and what would have to be an important piece of knowledge to have, whilst trading and avoiding short selling and losing potential profits...Worth a read if you need to freshen up!

Traders often fall into the trap of shorting the market too early for several reasons. One common mistake is overreliance on technical indicators. While indicators like the Relative Strength Index (RSI) or Moving Average Convergence Divergence (MACD) can be valuable tools for identifying potential reversals, they can also mislead traders, especially during strong uptrends. Overbought signals may persist for extended periods in a robust uptrend, leading traders to initiate short positions prematurely based on these indicators.

Another contributing factor is the failure to assess the strength of the prevailing trend accurately. Inexperienced traders may misinterpret minor corrections or consolidations within an uptrend as signs of a reversal, leading them to short the market prematurely. Without a solid understanding of trend analysis and the ability to gauge trend strength, traders may enter short positions at inopportune times, missing out on potential profits as the uptrend continues.

Divergences, a popular trading signal used to indicate potential trend reversals, can be invaluable tools for traders looking to avoid premature short positions. Unlike traditional technical indicators, which may give false signals during strong uptrends, divergences offer a unique perspective by highlighting discrepancies between price action and momentum.

Bullish divergences occur when the price of an asset forms lower lows while the corresponding indicator forms higher lows. This suggests that despite the downward price movement, buying pressure is building, potentially signalling an upcoming reversal to the upside. By identifying bullish divergences, traders can avoid shorting the market too early and wait to confirm a trend reversal before entering short positions.

Conversely, bearish divergences occur when the price of an asset forms higher highs while the indicator forms lower highs. This indicates that although the price is rising, the underlying momentum is weakening, potentially foreshadowing a reversal to the downside. By recognising bearish divergences, traders can exercise caution and refrain from shorting the market prematurely, waiting for confirmation of a downtrend before entering short positions.

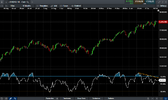
Let's illustrate this with an example by revisiting the US NDAQ 100 contract. This index has been on the run, and despite the prevailing trend, it has become a magnet for retail traders who want to capitalise on perceived overbought conditions or simply look to be on the “right” side of the trade when sentiment shifts.


The US NDAQ 100 has been in overbought conditions this year and any clean bearish divergences that indicated potential reversals were short-lived, such as the one back in December last year. If we look at the current RSI readings it is indicating a sideways market also known as consolidation with momentum potentially slowing down however there isn’t any confirmed bearish divergences.
1709424392478.png
 
Top