Australian (ASX) Stock Market Forum

Stock Screener Swing Trading Settings

Joined
21 February 2022
Posts
5
Reactions
5
Hello all, wondering if anyone can share their TradingView (or other) stock screener settings, preferably for swing trading. Trying to identify leading stocks which are fast movers/highly liquid and the biggest gainers over the past 1, 3, and/or 6 months. I've played around with a few custom settings but still finding it difficult to create a few varieties that work consistently.

I don't expect to find many results in this current market environment, however I'd like to be prepared once we find some stability and enter the next bull market.

Cheers in advance!
 
Have a look at ChartSchool in StockCharts.com, there is a section in there with scanning resources, examples, and tutorials.
Examples are written for StockCharts but treated as pseudocode they should be easily migrated to TradingView.

Also, joining the ASF members forum and digesting everything contributed by @peter2 would be another good place to start.
 
@Joe90 Thanks for the compliment. I'd also like to refer the OP to the chart threads by @tech/a .

First, M'Lord lets define swing trading as a short term trading style with an average hold time of 3 - 5 days. You're correct that we want to find the fast movers with high volume. It's easy finding these but I assume you've noticed that most screeners find them after good tradable swings have happened. It's not much help finding stocks going up 100% in the past 6 months. We want to find them when they start to move.

Second, I'm assuming that you want to trade ASX stocks not US. If you want to trade US stocks then you must be aware that there's a big difference in the market dynamics. The US market is huge and there's always plenty of fast movers.

In the Aussie market (ASX) the best swing trades appear when there's huge volume. Small cap stocks spring like gazelles and the mid caps run like buffalos.

IMO the trick to swing trading well, is preparation. We need to know exactly what we're waiting for in a trade setup. The screeners can find the high volume bullish bars (HVBBs). This is the easy part. Once we find the HVBB, do we buy it asap or do we wait for a volatility contraction pattern (VCP) *? We can choose to specialise in one style or do both OR we can look at the intraday chart (1hr) to find our VCP setup.

When you go through the charts that your screeners show you, you'll see that in many charts there is a small pause in momentum. This shows up as an inside bar or a few down bars or a shallow sideways trading range before momentum kicks in again and price zooms higher.

If you take the time to notice this, then these patterns become the basic tactics for your trading plan.

If you've understood this so far then you realise that the screeners are only a rough tool to find the type of stocks we want to trade. The screener doesn't find our trading setups. We create a watchlist from the screening results and monitor the charts for our setups. We're prepared. We anticipate the break-outs by placing buy stop orders in the market.

This is only the beginning. We've got to decide how many shares to buy and most importantly when to sell. These aspects are not related your original question.

* If you don't know these terms, look them up.
 
M'Lord, forgive me for pressing my point but I hope it's of use to you and other readers that feel the same frustration when looking at the results of screeners.

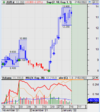
While you may look for % gainers over time, I look for HVBBs. These are found by my scans and marked with a blue arrow. This chart example shows a HVBB that was found by the scan. Wannabe swing traders will look at this chart and remark that price has gone too far. It's too late. What a useless scan (screener) and move onto the next chart.

swinga.PNG

I see the chart as a potential swing trading candidate and save it to a watchlist. I monitor the chart everyday waiting for a pause in momentum because I want to buy into the next swing higher. I mentioned a few examples of what I'm looking for in my previous post.

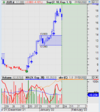
swingb.PNG

Eight trading days later, the chart shows that price momentum has paused and price is going sideways with very low volume (important). Once this blue rectangle forms I can place a pending buy stop order in the market. If/when price trades at 13.91 buy XXX shares with a limit price of 14.00.

swingc.PNG

My pending buy stop order is triggered and the swing trade is started. Now, I monitor the trade and sell on the first signs of weakness which is shown by the two consecutive down bars. I buy at 14 and sell at 17 for a result of +20% (8 days). Next trade.

The screener (scan) is only the initial tool. It's crude and shows lots of crappy charts. We can spend time sharpening the tool by including additional filters but it's only the start of our trading process. The screener's only job is to find plenty of charts that may or may not provide trading opportunities for us.

(Note: More than half of the charts I monitor do not trigger a trade. Of those that trigger a trade 50% are losing trades.

The trader does all the work and I hope that you appreciate a little more the importance of patience, diligence and discipline that a trader must have to be successful.
 
In the Aussie market (ASX) the best swing trades appear when there's huge volume. Small cap stocks spring like gazelles and the mid caps run like buffalos.
Oooh, love the animal analogies!

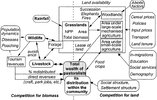
In fact, the whole stock market and traders/ invrstors can be likened to something in the Serengeti system...

I'm a tiger... according to Chinese lunar years. ?

F2.large.jpg
 
@peter2, I don't even know where to begin - thank you for taking the time to write that thorough explanation. I sincerely appreciate it!

Your logic makes complete sense and resonates well with me and my trading approach. I basically want to use scans to help me populate frequent daily watchlists with potential stocks that I can monitor over the next few days or weeks as I wait for the next swing entry. As you said, it's preparation.

You are correct in your assumption that I will be trading the ASX. I will admit however, that I am finding it slightly difficult to find many ideal opportunities on the ASX, especially (and obviously) compared to the US. I do like your take on small-to-mid cap stocks. I have been predominantly eyeing highly liquid mid-to-large caps. Given my relatively small trading account size, would you recommend also focusing on small caps with an enforced higher risk management plan (which I currently have in place)?
 
Wannabe swing traders will look at this chart and remark that price has gone too far. It's too late. What a useless scan (screener) and move onto the next chart.
This post was great! Buy high, sell higher.

I hope you don't mind me adding your comments to my personal study notes :)

Again, thank you so much.
 
Thanks @peter2 , I wasn't expecting that. We certainly all got our 5/- worth of mentoring there. A swing trading summary in a couple of excellent posts.

I was thinking of the 'teach a man to fish' parable but got sidetracked somewhat...

external-content.duckduckgo1.com.jpg

external-content.duckduckgo.com.jpg

external-content.duckduckgo3.com.jpg
 
Further suggestions for you, M'Lord. Screeners (scans) will show you what we want to see but they'll also show us lots of crappy charts. We try to minimise the crappy results by adding filters (volume, price ranges, indicator filters etc) but we'll never create a scan that gives us perfect results.

I want to get into the price move (swing) soon after it starts. So I must know what this looks like on a chart. There are two main formations that I like to see in the charts I want to trade. One is a higher low (HL) just prior to my signal bar that is found by my scan. The other is a sideways consolidation in price (trading range) and the signal bar indicates a break-out of this range.

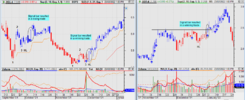
Examples of 123 Low reversal pattern and a BO of a consolidation (range, there is also a HL).

swingd.PNG

After the scan (screener) has done it's job I check the results with a handy checklist of the things I want to see on the charts. The top two items on my checklist are the presence of a HL and/or a prior trading range. There are other items on the list and these help me assess the risk:reward.

My suggestion then is to create a scan (screen) that finds the charts you want to trade. Tune them a little with some basic filters (price between 0.02 - 1.00, volume > 100K/wk, EMA(10) > EMA(21) , etc... ) .You want to find them early, not late. Look for daily, weekly changes before monthly ones.

Once you've got the screener doing a reasonable job. Create a checklist with the things that are important to you that help you decide if the probability is high enough for you to consider a trade. OR you might have a preliminary checklist that helps you choose which ones go into your watch-list and are monitored each day for a tradable setup.

You may think the idea of a checklist is a bit basic or even beneath you (primary school stuff). In my case, I know my checklist intimately and rarely look at it. Well, when the market beats me up and it does every now and then, when all I get is losing trades, when I start making basic mistakes (that cost money) I get that checklist out and it shows me that I've been trading less than perfect setups. The checklist reminds me what I should be looking for in a trade.
 
Hello all, wondering if anyone can share their TradingView (or other) stock screener settings, preferably for swing trading. Trying to identify leading stocks which are fast movers/highly liquid and the biggest gainers over the past 1, 3, and/or 6 months. I've played around with a few custom settings but still finding it difficult to create a few varieties that work consistently.

I don't expect to find many results in this current market environment, however I'd like to be prepared once we find some stability and enter the next bull market.

Cheers in advance!
Hi lordbish.

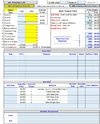
This Calculator may help with your Swing Trading calculations.
9 ABC Calculator.jpg

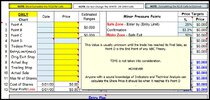
There are Comment Box guides (Red Triangles) within the Calc explaining what to enter where.
ABC Swing Chart Comments.jpg

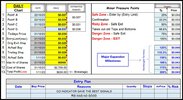
And there is a Tab with some completed examples.
ABC Swing Chart Example.jpg
Anyone interested in a working copy would need to "Direct Message" me.

Cheers.
DrB
 
Yes Please your work sheet is much more polished than mine.

Hi rogerlg.

The following is how we Direct Message someone, simply click on my avitar then click “Start Conversation”.
1641771501960.png

1641771514919.png


That opens up an area where individuals can chat.

There are more calculators that may help – look at the Forum - “DrB General Help for Beginners”, page 2.
1645755810898.png
1645755831398.png

I only visit here when time permits, usually once or twice a week.

Cheers.
DrB
 
Last edited:
Yes Please your work sheet is much more polished than mine.
Hi Rogerlg,

You should look at these icons, 1645763779725.png top right on the ASF site, they display numbers that tell you of 'Conversations or Alerts' that you may need to acknowledge.

DrB
 
@peter2

Just an observation I have made over time. One which I visually applied to the Charts above.

The winning trades show clear Volume absorption of supply prior to the winning move.
In the exhaustive sample of 1, I note no exhaustion before the signaled breakout. I also
Note Supply returning strongly at exit points.

My point is that its been my observation over time that the drying up of supply or the
Above-average increase of supply before both breakout moves in long or short trades shows a
beacon in the distance. And can be a signal of its own (often premature!).

Have you noticed this or do you consider it in your analysis?


Thanks @tech/a , for some reason this post and many similar in other threads often comes to mind when I am considering pressing the buy or sell button. Thank you for your many informative posts on supply and demand which from days as a kid helping an uncle in the fruit market says it all about price and movement.

Sorry it's a bit off topic, more about SUPPLY AND DEMAND

The fact as days unfold that buying and selling volume change dramatically prior to large moves, and that making sense of it is to my advantage, and that it is thing of beauty seeing such as large sell volume/supply lead to an increase in a stock or index price, rather than a loss.

I wish to visit the rellies and friends in Europe next year, N to S, from Scandinavia/Rus to Iberia and west to east, from near Persia way to the West coast islands of Ireland. It will be First Class from closing my door in the Hotel door to my return, as my days of hitching and sleeping rough are far gone. So I need to have a very big, loose wallet.

So although not going all in on recent trades it has been near all in on some trades. Modi is the man, having a firm grip on the Indian masses and with the believers in Allah quiet over that way, and with ole sleepy Joe affable, and ole Xi cowed, and ole Putin settling on some cash, whores and a boat, it would appear opportune for me to bet on the Nifty Fifty, not all or nothing, just accumulating now Aussies/Rupees in NDIA, I just thought I'd post this snapshot of NDIA.

NDIA shows these large volume discrepancies on both sides of the ledger, buy/sell and the charts show quite sudden moves in many timescales. I'll just post a summary of trade from this morning and a chart to give an idea of this stocks/etf's longer trajectory.

ndia.png

So if anyone is in to supply/demand/volume, Nifty Fifty, ETF, Trade the trend, Aussie/Rupee exchange rate, I'd appreciate their thoughts.

What can go wrong ...

Bloody everything and anything, that's what, LOL.

gg
 
Top