- Joined
- 22 April 2021
- Posts
- 8
- Reactions
- 5
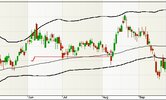
im currently trying out some strategies through Backtesting to see what the results are like. i plotted the stop losses to make sure that what i expect to happen is actually happening. i came across something strange. can anyone tell me why i get the dog leg in the Max Stop Loss plot? this isnt the only ticker it happens to. Also,why wasnt the stop loss activated in July when the bar closed below the stop loss?

here is the code im using
StopLevel = Param( "Max stop %", 3, 0.1, 10, 0.1 );
SetTradeDelays( 0, 0, 0, 0 );
Buy = Cross(Close,BBandTop(Close,100,3)) AND uptrend AND LiquidityFilter AND VolatilityFilter;
Sell = Cross(BBandBot(Close,100,1),Close);
BuyPrice = ValueWhen( Buy, C );
ApplyStop( stopTypeLoss , stopModePercent, StopLevel, True );
Equity( 1, 0 ); // evaluate stops, all quotes
InTrade = Flip( Buy, Sell );
SetOption( "EveryBarNullCheck", True );
stopline = IIf( InTrade, BuyPrice * ( 1 - 0.01 * StopLevel ), Null );
PlotShapes( Buy*shapeUpArrow, colorGreen, 0, Low );
PlotShapes( Sell*shapeDownArrow, colorRed, 0, High );
Plot( Close, "Price", colorAqua, styleBar );
Plot( stopline, "Max stop line", colorRed, styleThick );
