Australian (ASX) Stock Market Forum

PAV Technical Analysis and Trades

Joined
14 December 2010
Posts
3,472
Reactions
248
Hello all,
Many of you would not know me.
I was very active on this forum around 2011-2014.
I traded the FTSE Futures.
In 2015 I experienced a chronic illness (Lyme Disease and CFS).
This left me mainly housebound, unable to look at electronic screens.

I never thought I would trade again.
After the COVID crash I ventured into some investing (a handful of stocks including NAB @$15) and entered an Oil ETF (OOO) @ $2.90.
I have since exited the ETF at $6 (50%) and $9 (50%). I sold all my stock, including NAB @ $31.

*In this thread I will post technical analysis from time to time, with various thoughts* (just my :2twocents)

I recently decided to place some medium term positions on ETFs to making money shorting the markets.
BBUS and BBOZ.
I entered on 6/6/22 after the push up from the lows.

I am holding two for the medium term and just about to exit a position today on a short term one.

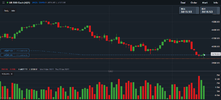
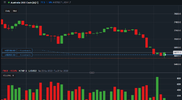
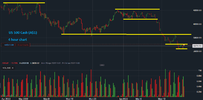
Rather than posting the BBUZ and BBOZ charts I will post ASX200 and DOW. This will give an idea of the markets at large.


I will post charts and do analysis from time to time.
Feel free to join in the discussion :)
DOW.pngASX200.png
 

Attachments

  • DOW.png
    DOW.png
    52.7 KB · Views: 9
  • ASX200.png
    ASX200.png
    44.5 KB · Views: 9
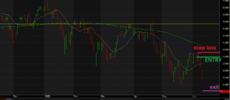
This is my exit.
Although there was no signs of a bottom, my intention was to exit around the previous lows.
With such a sharp move down, I am happy to take such a decent profit with such a small initial risk.
FED meeting this week too. Lots of volatility. Just want to bank that one, and hold the medium term ones.

DOW Chart below.

DOW exit.png
 
Here are a couple more trades.
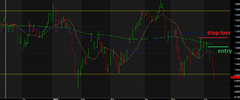
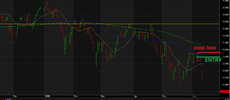
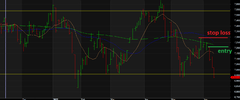
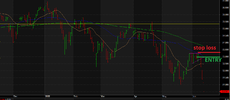
After the move down, I'm taking a long position on the US500 cash (A$1) CFD and the Australian 200 Cash (A$1) CFD.
8 contracts on each = $8 per 1 point move.

These are the daily charts below.
I would consider it a reasonably aggressive move.
It's just below the previous lows from May on the US chart, and a bit lower on the AUS.
After a sharp move down I'm looking for a good RR long in the short term.
A few bars have held at this level so far.

If it moves in my favor I will look to get my stop to B/E (breakeven) as soon as I can, and reassess the trade each day.

My main goal is not to be right... it is to get into good RR positions, so as to build a positive expectancy over time.
I don't mind losses, as long as the trade fits my criteria and is in a good RR position.

US 500 cash.pngASX 200.png
 
Here are a couple more trades.
After the move down, I'm taking a long position on the US500 cash (A$1) CFD and the Australian 200 Cash (A$1) CFD.
8 contracts on each = $8 per 1 point move.

These are the daily charts below.
I would consider it a reasonably aggressive move.
It's just below the previous lows from May on the US chart, and a bit lower on the AUS.
After a sharp move down I'm looking for a good RR long in the short term.
A few bars have held at this level so far.

If it moves in my favor I will look to get my stop to B/E (breakeven) as soon as I can, and reassess the trade each day.

My main goal is not to be right... it is to get into good RR positions, so as to build a positive expectancy over time.
I don't mind losses, as long as the trade fits my criteria and is in a good RR position.

View attachment 142930View attachment 142931

Matt what does 'RR' stand for? It's used a lot in this post but I can't see where you have defined it, maybe It's there and I missed it or maybe it's a term well used in your circle.
 
Given how insane this market is getting, I am not going to attempt to trade dips! I’m only going to short rallies!

The last long trades were a good lesson in risk management. I saw things turning quick yesterday and I just got out. -$200 is a great result given how someone holding longs could have been slaughtered had they not reacted.

My strategy will be to look for short entries in the first 15-60 mins of trading. The RR is enormous right now. Even 25% accuracy would result in massive profit!

We’ll see where things go from here.

I’m still in BBUS and BBOZ.
They are the ETF’s that are shorts magnified 2.5x those markets.

$20,000 +$20,000

On open today I will be up around $15,000 total from my entry on 6th June.

That will be a hold.
 
I just got in on the Aussie $200 ($1 spot CFD)

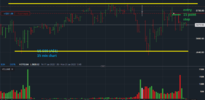
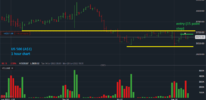
What I’m doing in this market is being aggressive at market open, or within the first 30 to 60 minutes. If I think it’s in a spot where it’s just going to drop I’m prepared to take a position, a small one. Here is the chart for the market this morning. I actually took this entry on the first one minute bar. It was a 10 point risk, $5 per point (5 contracts).

If that had failed, I would’ve looked the price to set up a bit further up and then taken a better set up for 10 contracts. I’m actually going to try to do this in conjunction with the daily chart in terms of identifying good spots to get in for a position that I might be able to hold. I’m planning to do this with the FTSE also. My aim is to build up contracts in good positions so that if this thing tanks I can ride a big wave with many contracts. I’m aware that this could and will cost me money that I could’ve cashed in on a shorter term move. But I’m really trying to take advantage of this rare opportunity with the way the market is at the moment.

I also plan to do the same thing when this bottoms out eventually and I get back into the long side. I want to accumulate contracts. The small losses will be tiny in conjunction with any contract that I do manage to enter in strong spots that don’t get taken out by larger market moves. Depending on where the daily chart is at and how good or speculative any movies, will determine how many contracts I take. But I will not be betting the house on any one position.
 
Very good question mate. I asked myself this!

It's something I do myself when I see overwhelming evidence in a timeframe I'm trading
that challenges my bias. (Futures).

This could be and often is a very high volume and range spike in my direction (If I'm on the opposite side to a prevailing strong directional move) and an immediate reversal Back towards the prevailing strong direction.
Can also be a tight consolidation and then a convincing move in the Prevailing strong direction.
That’s the problem with any bias. But I think one good rule of thumb is that if the trade is not behaving as it should, then consider if the opposite trade is a good one. Much easier said than done when the mind is in a place of cognitive dissonance!

Huge volume, and tight consolidations are two things that you drilled into me, and two things that serve me very well.

I think my lesson from those trades yesterday is be very careful when trading against the market, particularly one that is moving ferociously. And if deciding to take a trade (in the opposite direction) after a market move, wait for sufficient confirmation.
When trading IN the direction of the strong trend waiting for too much confirmation can pose the opposite problem.
 
After spending a couple of days at the screen, I've realised that I don't want to be worrying about intra-day moves at the moment.
My goal is to try and accumulate some contracts, ready for a larger move if things completely crash.
I am going to turn my focus to the S&P500.
Because this is half the level of the FTSE and Aussie 200, I can get 2x the bang for my buck, with only half the margin requirement.

I will be analysing the bigger picture, from the daily chart, and then using the 4 hour mainly, in conjunction with the 1 hour, and possibly 15 min if I want to maximise the setup in a higher RR place.

The 4 hour chart is my preferred time-frame here and my intent is to short rallies. The better the position on the longer term chart, the more contracts I will be prepared to take. I might take a position with a stop 50-80 points away. 5 contracts for a good setup ($250-400 risk). 10 for a great setup ($500-800 risk).

On the 1 hour chart, I can take more aggressive entries with less risk per trade if there is a really good setup. (for example 15-40 point stops. $75-400 risk).

In this market it is very much worth the risk. I want to wait for decent setups, but not be so selective that I risk missing the next down move.

I will continue to post my analysis.
 
I will continue to post my analysis.
Howdy @pavilion103

Firstly welcome back. I did wonder what had happened to you when you suddenly stopped posting "way back then":wheniwasaboy:

I always remember you were super methodical about your trading so I expect any input you add to ASF will be greatly appreciated by many punters.

The main thing is your health has improved. All the best.:)
I really appreciate that mate. Thank you. I find it weird when people remember me because I have been gone for so long. But I guess I did post many threads which live on.

I am no expert but I will certainly share many things that I have learned which have brought me success!
 
Top