Australian (ASX) Stock Market Forum

Old MT4 - FX account, Use it or lose it?

Joined
12 January 2008
Posts
7,287
Reactions
18,138
I've got an open MT4 account that I'm not using, so rather than close it I thought I'd try trading it and see if I can rekindle some interest in FX trading in ASF. The account is small enough that it wouldn't concern me if I lost most of it. However I don't trade to lose money. I'd like to see if I can double or triple the balance without trading recklessly.

I've written a few more introductory posts but as I've been writing them I had my first trade so I'm going to show this as a teaser trade.

T1: XAUUSD - long, if 2300 provides some support.
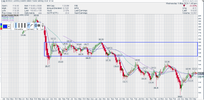
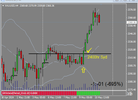
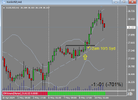
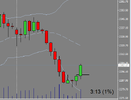
This is a 4H chart with the only indicator that I'm using, Bollinger Bands (20,2). After a rapid selloff yesterday, price has paused outside the lower band (oversold or extended) setting up a potential reversal trading opp. This is most definitely a high risk reversal as both the 4H and daily trends are impulsively down. The only reason for me to be trading this reversal is that I'm very clearly bullish gold atm.
xauusd1.PNG xauusd2h.PNG

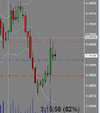
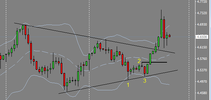
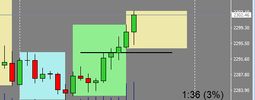
XAUUSD: 4H and 1H charts

The setup formed when the 1st 4H green bar closed above the prior long legged doji bar. It's one of my fav candlestick reversal patterns.
On the 1H chart (right) the trigger level coincides with the prior Aus session high. This setup could be called a prior session BO trade.

Trade Management: This was always going to be a quick trade as most of Europe is on holiday (May Day) and the US market is waiting for the next morning's FOMC statement. Price is unlikely to go very far with this uncertainty present.

Details: Buy 2290.5, (iSL 2283) Risk = 7.5 Exit Sell: 2301 for +10.5 or +1.4R result

The pending FOMC news will rock the market tomorrow morning and I'll wait to see if there's a trading opp after the news (if I'm awake).
 
There's generally a tradable swing on the 4H charts each week in most markets and that's what I'm trying to trade in this thread.

I plan to place about 5 trades each week and risk 4% on each trade. This is about 20 trades /mth. If I can win 50% of them with an ave win of +1.3R and an ave loss of -0.8R this would win an average of 5R /mth. If each R unit is worth 4% then the monthly gain would be +20%. At this rate the account would double in 4 mths and triple in 6 mths.

The account size is small and even quadrupling the balance would only buy a dinner for four at a fancy restaurant. It's not about the money. Trading like this is like doing the daily Wordle or crossword.

That's the "back of an envelope" plan without any of the important details. This is pretty much the planning technique of most politicians. Like many of these ad-hoc political plans it will fail without more thorough planning to create a detailed process with appropriate risk controls.

I'm currently quite busy trading both ASX and US securities and spend most days out of the office playing tennis with friends. However summer has ended and the daylight hours are shortening. This may give me some extra time to trade this account but this activity will remain a low priority for me.

I'm describing a part time trading activity that's suitable for others that work during the day. Most the major market moves in the FX et al markets happen during the UK and US time zones (after work in Aust).

The trading timeframe I'm going to use is the 4H timeframe. I'll be referencing the larger daily timeframe often and occasionally I'll mention a setup on the 1H chart.

In summary, I'll trade a few times each week with the aim to win a few R each month.

Note: This thread is for educational and entertainment use only.

I welcome all questions and will reply to all unless other ASF members do it before me.
 
How are we going to trade a few times each week and ensure we win a few R each month?

The easiest and most probable method is to trade with the daily trend. The FX markets can move in one direction (trend) for many days, weeks and months. Trading with the trend is our overall strategy but we'll need a few tactics to identify times where the risk:reward for entering the trend at these times are acceptable.

The most common tactic to join a trend is to buy a break-out or sell a break-down at a clearly defined price level. This is my preferred entry tactic when trading equities but my success in the FX markets using this method is marginal. This is because these markets are dominated by a few large liquidity providers. These market makers (MM) can also see these levels and act in their own interests to the detriment of much smaller retail traders (us). We can counteract these MM games but it requires us using much larger stops sizes or trading more often.

Rather than play with the MMs I prefer to enter trends in these markets after pull-backs and take profits when prices get back to the prior swing high (or low) where the break-outs traders lie in wait.

Our first requirement is to identify the direction of the current trend in the market we're looking at. This is where things can get tricky. Our trading timeframe is the 4H charts and we can decide to trade the current 4H trend or we can trade with the larger (daily) time frame trend. There will be times when it's easy to trade the 4H trend until it gets tricky (goes sideways) then it's easier to trade with the daily trend until it goes sideways. Price doesn't always trend in one direction in fact it only trends about 20% of the time in all timeframes. I did say it gets tricky.

The best times to join the 4H trend is when it's the same as the daily trend. However this doesn't happen very often. When it does we need to be ready to join in.
 
Definition of a trend in any timeframe.

I prefer to look at the price structure to determine trend direction and strength. Others may prefer to use indicators such as a moving average (MA), or multiple MAs or oscillators above an arbitrary level (RSI, STO, CCI etc). I prefer to use price structure as price can pull-back quite deeply in an up trend, turning most indicators down even though price may be making a higher low (still in an up trend).

An up trend is defined after a higher swing/pivot low is formed and price is making a higher high.

A down trend is defined after a lower swing/pivot high is formed and price is making a lower high.

Using price structure means I don't have to place any indicators on my charts. However for this thread I will use a few. The main one will be the Bollinger Bands (20, 2) and another shows the three main trading sessions (Aust, UK, US) on lower time frame charts.

Note: I have an additional understanding about trends in that a trend may be impulsive or corrective. An up trend is impulsive if the HLs do not go below the prior HH. If the HL overlap the prior HH then I consider the up trend corrective (choppy) which portends an impulsive move in the opposite direction. An impulsive trend is much stronger and goes further than a corrective one. I'll use closer price targets in a corrective trend than an impulsive one. This understanding assists with trade management guidelines.
 
Once we know the trend direction and its strength we look for setups with acceptable risk:reward outlooks to join the trend.

The constant tug of war between supply and demand forms patterns in all price charts. In an up trend when supply matches demand we see a pause in the price movement. If supply is greater than demand we see price pull-backs. These pull-backs can be shallow or deep. Strong trends produce shallow pull-backs and weaker trends show deeper pull-backs. I use the appropriate tactic for the current chart pull-back.

If the pull-back is shallow (<50% of prior swing up) I prefer using a break-out setup and trigger.

If the pull-back is deeper and corrective I'll look for a reversal pattern to enter the trend.

That's it for the theory. i think it important to write it so that readers can understand my thoughts when I describe my trades. I hope it shows that there is some structure within the trading plans. I could write the trading plans with a series of IF... Then statements but I would add in a few OR statements as well.
 
Time constraints. One of the huge benefits of trading the 4H charts is that each bar needs four hours to form. You'd think I would only need to look at the charts every four hours. But alas, not so. Some markets start and end at different times so the 4H bars end earlier and later than the FX majority.

Changes in daylight savings time around the world (Aus, US, UK) have to be considered. This is my current 4H schedule.

gm1.png

The shaded times are those with higher volume.

Trade #1 that I've already posted (XAUUSD, green bar after doji) formed at 8pm locally (1300 broker time) and I noticed it at that time.
It's important to be disciplined and check the charts at the correct times. I'll miss many good setups as I'll be distracted or out of the office on many days. There'll always be another opportunity soon.
 
Note: It's a bit too late to look for 4H trades on a Friday. The week's tradable swing is most likely done.

I won't be holding any trades over the week-end unless it's a "hero" trade. I've noticed that my charts have too many opening gaps over the WEnd. Many charts even have open gaps during the week (wtf ?).

If this becomes a problem by triggering my always in the market exit stops I will close the account.

I plan to do a monthly update with the trade stats to show the journey.

The thread will end if I lose 50% or any time after I've doubled it.

<4H to the FOMC news, doubt I'll even be awake then.
 
1. How are we going to trade a few times each week and ensure we win a few R each month?

2. The easiest and most probable method is to trade with the daily trend. The FX markets can move in one direction (trend) for many days, weeks and months. Trading with the trend is our overall strategy but we'll need a few tactics to identify times where the risk:reward for entering the trend at these times are acceptable.

3. The most common tactic to join a trend is to buy a break-out or sell a break-down at a clearly defined price level. This is my preferred entry tactic when trading equities but my success in the FX markets using this method is marginal. This is because these markets are dominated by a few large liquidity providers. These market makers (MM) can also see these levels and act in their own interests to the detriment of much smaller retail traders (us). We can counteract these MM games but it requires us using much larger stops sizes or trading more often.

Morning Peter,

1. We want to enter the trend at the desired technical trigger and sit in the trade. As you have stated: FX trends tend to last. This will cut down on faffing constantly with entries/exits reducing comms.

2. Agreed.

3. So we use Options instead. Lots of leverage will reduce (fix risk) and if you catch a mover allow large profits.

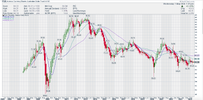
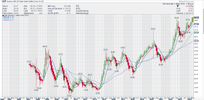
Some currencies

Screen Shot 2024-05-02 at 5.36.01 AM.pngScreen Shot 2024-05-02 at 5.36.40 AM.pngScreen Shot 2024-05-02 at 5.37.04 AM.pngScreen Shot 2024-05-02 at 5.37.29 AM.pngScreen Shot 2024-05-02 at 5.38.26 AM.png

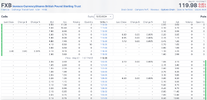
GBP looks like a potential for me.

Options only go to 7mths, but adequate.

Screen Shot 2024-05-02 at 5.42.02 AM.png

Screen Shot 2024-05-02 at 5.44.25 AM.pngScreen Shot 2024-05-02 at 5.44.44 AM.png

So we have 7mths:

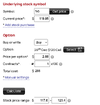
Screen Shot 2024-05-02 at 5.47.49 AM.png

For arguments sake let's make 140 the target:

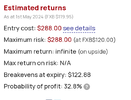
At expiry the option would be worth $20 - $2.88 = $17.12 = $1712.00 or R/R of 6:1.

jog on
duc
 
Thanks @ducati916 , good post that shows the low risk high reward of an options trade. Shame I didn't ask you about an option trade when copper was at it recent lows. My opinion for higher prices was very bullish back then.

I see the markets have moved after Powell's comments. Gold and resource currencies all up. Lots of volatility in the USDJPY and all yen pairs, so I'll pass on them.

The spike up in many charts make the immediate trend (4H) unclear. Prices seem to be in a neutral zone.

Here's one trade idea. NZDUSD sell.

Daily trend - down, 4H trend - down Price has retraced to the mid band and formed a doji with a high wick.

Trade idea is to place a pending sell stop below the low of the doji and hope price resumes it's down trend after the Fed spike.

nzdusd1.PNG
 
Great idea Peter. I don't trade ,( I can lose my money a bit more slowly elsewhere..:() but I'm sure it will stimulate interest and edcuation for some punters.
 
Sorry I haven't been looking at my MT4 charts this week.
Trading US hours plays havoc with my sleeping pattern. I know I should move to Perth. One day.

There's one or two good moves during the week when looking at the 4H charts. Let me show you what I'm looking for to trade.
I didn't trade any of these, although I may have profited from them in my ASX and US equity accounts.

GOLD: Daily - upward momentum has paused. Price has been going sideways for a few days. However I remain bullish these market and am looking for the next rally to start on the 4H chart. Looking for a candlestick reversal pattern of clear bullish bar up.

gold2.PNG

I arrowed the 4H bullish bar that formed at 2400hr (Syd) 9/5. It was the start of a nice rally.
The hour was a bit late as it was just after the start of the US session. However there was a clear BO level on the chart and one could have placed a pending buy stop order to trade it before it triggered.

When there's a move in gold, anticipate one in silver (XAG).

xag1.PNG

Silver shows the same sideways movement and a break-out of the recent highs. This BO was earlier than the one in gold. In fact it triggered about 4pm (Syd) on the 9/5.

This BO in silver may have prepared you for the BO in gold that happened later.
 
As you may know I'm watching the copper market as well as the other precious metals (Cu is precious too).

You may not be surprised to know that the price of copper also rallied at the same time as gold.

cu4.PNG

At the moment these markets are very correlated to each other and the USD. Miss one market means we'll miss them all.

This also happens in the currency markets as they are all very correlated. Worth remembering so that we can control our risk.
 
Another pair of charts to look at if you're interested in trading these currency markets. There's usually one good tradable swing in these markets each week. Some weeks it's the currency pairs that move. Other weeks it's the indices or commodities (gold, silver). This week everything moved. It's unlikely that we'll get into all the moves but getting into a few that work out well helps us on our way.

When trading the currency markets we must know when the important news is being released. We don't have to have an opinion on the news or even guess which way the market will move after the news. Important news will move the markets for a few days at least. This week provided a good example.

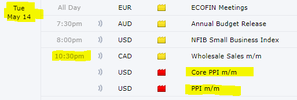
The first important news was the US PPI numbers (noted in red on the Forex Factory Calendar).

news2.PNG

The 4H bar closed at 11pm (Syd), after the news. We wait for this to close to see if there's a signal bar on the major currency pairs that we wish to trade.

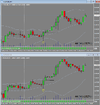
aud1.PNG

Note the clearly bullish 4H bars that closed at 11pm in both the AUDUSD and EURUSD charts.
The daily trends were up in both pairs so we're looking for a setup to go long. The news provided these setups for us.

Both trades reached +1R without any worries, There was important news the next day (US CPI) and it would have been wise to reduce or close these positions before this news. The CPI news did cause some volatility. You may notice the long wicks 7 bars later. However both trades hit my +2R targets.

Summary: We don't need to have an opinion about the news or how it may effect the market. All we need do is wait and see what happens in the markets. In this example the news formed clearly bullish bars for us to trade.

Say you closed one trade at +1R before the CPI news and let the other ride which hit the +2R target. That's and easy +3R for this week without looking at lots of charts. Yes, the indices and both the XAU and XAG markets moved up nicely this week also. It was a very productive week for the prepared traders.
 
Screen Shot 2024-05-19 at 6.41.52 AM.png

Since every currency is measured against the USD, the USD falling should result in you currency going up.

USD lower is Treasury and Yellen policy.

jog on
duc
 
Top