Australian (ASX) Stock Market Forum

IOZ - iShares CORE S&P/ASX 200 ETF

My trouble is that, although I do read charts and recognise that there is potential for further falls, I don't want to rely on the falls coming to fruition.

So, I've deployed another 10% cash into today's fall, not all in IOZ, but still have 60% cash burning a hole in my pocket.

KH
 
This is for starters. Worst calendar months for XJO since May 1992 (I don't have data before then), in order.

June 2022 is right up there with them.

XJO Worst Months since.png

Maybe I'm just looking for a dead cat bounce when I selected IOZ for the July 2022 tipping competition.

More soon.

KH
 
If the last post didn't convince you that I've got kangaroos loose in the top paddock for continuously selecting IOZ, maybe this will.

Performance of ASX indices for the financial year just completed:

ASX Indices FY 2022.png

With numbers like these, I'm glad @Joe Blow hasn't charged an entry fee for the last six months of the monthly tipping competition. Buckley has more chance than IOZ.

KH
 
This is for starters. Worst calendar months for XJO since May 1992 (I don't have data before then), in order.

June 2022 is right up there with them.

View attachment 143489
Maybe I'm just looking for a dead cat bounce when I selected IOZ for the July 2022 tipping competition.

More soon.

KH

I have a bunch of ETFs to invest in over the next few weeks/months and this is one of them. My own tactic is to drip feed funds into the next six months for the inevitable recovery. Not sure if an ETF wins the monthly comp though, unless there's a proper capitulation, although BBOZ might win that.
 
Now, those last two posts are in the past. Lets look at July 2022.

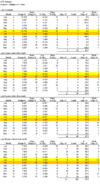
The table below shows clearly that July has the lowest range (high to low) and one of the lowest percentage change of any month. Doesn't matter if we're looking at short, medium or long term stats. July is the month where everyone goes into hibernation mode.

However, I'm an old fuddy-duddy, stuck in my ways. I'm like a poker machine player who keeps on pulling on that stick, hoping that the next 5 reels will give a jackpot. I'm hooked.

So, yes, it is IOZ again for the monthly tipping competition. Whether it be the dead cat bounce, the one year when July won't be a boring month, or just the fact that I don't know how to type any code other than IOZ .. its my choice.

BTW ... I should declare that I added more IOZ to the portfolio in the closing auction today. All the more reason to hope for a bounce.

KH

The table:
XJO Analysis 2206.png
 
I have a bunch of ETFs to invest in over the next few weeks/months and this is one of them. My own tactic is to drip feed funds into the next six months for the inevitable recovery.
My name is Kevin and I'm not a good stock picker ....

This ETF (IOZ) works for me because it is index based, and history shows that only the very gifted will beat a broad based market index over a long period of time. Drip feeding into this type of ETF is one of the better options for getting into the market, although, for me, the tap ran a bit quickly in today's closing auction.

Not sure if an ETF wins the monthly comp though, unless there's a proper capitulation
You would be surprised just how well IOZ has done in the monthly competitions. More often than not it is in the top half of the field. That's a win as far as I'm concerned.

KH
 
As most readers would know by now, IOZ is an ETF which is based on the major Australian index, XJO, the S&P ASX 200 index. So, when I analyse XJO prices, it is really an analysis of IOZ's price. ETF distributions are just an added extra.

July 2022

July saw XJO rebound strongly from the April (-0.86%), May (-3.01%) and June (-8.92%) sell-off. XJO finished July +5.74%, the best of the four major indices. This tells me that the second 100 stocks in the index had a fairly good month.

As good as July was, it still doesn't make up for the April, May and June losses, nor does it bring us anywhere near to being ahead on a year-on-year (YOY) basis. XJO is still down 6.05% compared to where it was at the end of July 2021.

August 2022

XJO fell behind on a YOY basis during June 2022. The last time this happened was in March 2020, the height of the COVID sell-off, and it stayed this way for eleven months until February 2021. Also to be taken into account is the fact that XJO is still 9.01% below the high water mark reached on 13 August 2021, so it is a tall order to expect that August 2022 will see a new high.

Falling behind on a YOY basis is, for me, a major event. In the past XJO has either immediately rebounded (i.e. only one month behind on a YOY basis), or stayed behind for at least four or five months. XJO has twice before (on 5 January and 20 April) tried to breach that previous high, failing both times. Things don't look good for August 2022.

However, there are signs of improvement.

The new teaching of Bidenomics tells us that two consecutive quarters of negative GDP growth is not a recession (see this news story), so, although I don't expect new highs, there is hope that the general market will continue to improve during August 2022.

So, I'm tipping IOZ, as a proxy for the general market, again for the August tipping competition. If it doesn't at least make the top half in the results sheet, I'm going to blame Joe Biden.

KH

We used to not even call them recessions, they used to be called depressions, but given that after the Great Depression those little minor down turns seemed insignificant we changed the name of the smaller depressions to recessions.

Now after the GFC or as some people call it the “Great Recession”, these little “recessions” where unemployment is still low and new investment is still flowing don’t seem to nasty, so maybe it’s true and we need a third word to describe them.

I can totally understand why Biden’s administration wants to communicate that this is not a real recession (yet), because when the word recession gets used it strikes an emotional response in a lot of people which at the moment is probably not justified.
 
This is approaching some resistance, which prolly equates to 7500 on the XAO, but there's some significant downside support formed within the general upward chanel.

Screen Shot 2022-08-16 at 2.13.21 pm.png
 
It has been a very good recovery from recent lows.
Currently down approx 7%, but was down just over 16% during the June sell off.

KH
 
As always, IOZ is an ETF based on the main ASX index, the S&P ASX 200 index, otherwise known as XJO. The analysis here of XJO is the best way for me to analyse IOZ as it has a longer history, and devoid of any distribution adjustments.

Here's what I said about XJO at the start of August:
XJO fell behind on a YOY basis during June 2022. The last time this happened was in March 2020, the height of the COVID sell-off, and it stayed this way for eleven months until February 2021. Also to be taken into account is the fact that XJO is still 9.01% below the high water mark reached on 13 August 2021, so it is a tall order to expect that August 2022 will see a new high.

Falling behind on a YOY basis is, for me, a major event. In the past XJO has either immediately rebounded (i.e. only one month behind on a YOY basis), or stayed behind for at least four or five months. XJO has twice before (on 5 January and 20 April) tried to breach that previous high, failing both times. Things don't look good for August 2022.

The major event continues. XJO is still behind on a Year on Year basis.

XJO would have to finish above 7332.2 by the end of September to escape this dreaded YOY drawdown. This just ain't going to happen. Look at the attached image, in particular the Rank % Chg column. It shows that September is the worst performing month over the past 8 years, and second worst over the past 4 years. September 2022 could be a fun month for buy-and-hold types (like me).

So, why am I selecting IOZ for the September competition if the outlook is this poor? Goodness knows ... I need to be committed.

The only saving factor is the fact that when the general market performs poorly, then the larger cap stocks (generally) out-perform the smaller cap stocks. This happens for a number of reasons, the main one (to me) is liquidity. If there is a sell-off, quite often the forced seller of small cap stocks is a price taker, and there may be some really good bargains to be had for those who have a cash stockpile.

Since most stock selections in this competition are smaller cap stocks, and IOZ is based on an index made up of larger cap stocks, then IOZ has a fair chance of finishing the month in the top half of the leaderboard, as it did for the month of August. If this happens, then I'll be a happy chappy.

KH

XJO Analysis 220831.png
 
o - oh ... I sold a portion of my IOZ on Tuesday, but I didn't think it would make the news! ;)

KH
I see a positive in that the actual transaction went smoothly, which is not a given..on the other hand, it was soread among 200 stocks so..
But good processes in implementing ioz.kudos.
May be different on narrower ETFs
 
I see a positive in that the actual transaction went smoothly, which is not a given..on the other hand, it was soread among 200 stocks so..
But good processes in implementing ioz.kudos.
May be different on narrower ETFs
It certainly is different on 'narrower' ETFs. IOZ is the only ETF in my portfolio because of liquidity, it is index based, and it is based on the most widely used Aussie index, the S&P/ASX 200. As a result, if there is a big order (either buy or sell), then it will be only the largest cap, most liquid stocks which will be bought or sold by the ETF managers.

Of course there are other ETFs based on the S&P / ASX 200, and last time I looked there were some based on the 100 and 50 indices, too, any of those will do instead of IOZ. However, I steer clear of any ETFs which aren't based on these three major indices mainly because of liquidity.

KH
 
There is liquidity and there is liquidity. The broad-based ETFs are generally on the same level regarding liquidity issues and one ETF may not necessarily be more liquid than an other ETF of a similar type.

 
Analysis from the start of August:
XJO fell behind on a YOY basis during June 2022. The last time this happened was in March 2020, the height of the COVID sell-off, and it stayed this way for eleven months until February 2021. Also to be taken into account is the fact that XJO is still 9.01% below the high water mark reached on 13 August 2021, so it is a tall order to expect that August 2022 will see a new high.

Falling behind on a YOY basis is, for me, a major event. In the past XJO has either immediately rebounded (i.e. only one month behind on a YOY basis), or stayed behind for at least four or five months. XJO has twice before (on 5 January and 20 April) tried to breach that previous high, failing both times. Things don't look good for August 2022.

Further analysis from the start of September:
The major event continues. XJO is still behind on a Year on Year basis.

XJO would have to finish above 7332.2 by the end of September to escape this dreaded YOY drawdown. This just ain't going to happen. Look at the attached image, in particular the Rank % Chg column. It shows that September is the worst performing month over the past 8 years, and second worst over the past 4 years. September 2022 could be a fun month for buy-and-hold types (like me).

The reason for selecting IOZ in September still applies:
So, why am I selecting IOZ for the September competition if the outlook is this poor? Goodness knows ... I need to be committed.

On a year on year ("YOY") basis, XJO is still minus 11.7%. If it were to return to parity by the end of this month of October, XJO would have to rise 849.5 points, or 13.1%. The way things are going, Santa Claus will be coming down my chimney before we break this dreaded run of negative YOY returns.

Eeek! The outlook doesn't look good.

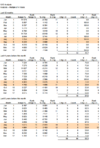
The only positive thing I can see is that on a long term basis (16 years) October is quite a volatile month with a range from High to Low of about 7.5%, the second most volatile month of the year, second only to April. Hang on to your hats for a wild October ride. The image immediately below shows details.

XJO Analysis Oct 22.png

Even though October is a volatile month, lets hope the volatility is positive, and that this run of poor returns stops, and October lives up to its reputation as a month providing positive longer term returns for investors.

As an aside, my great (x about 3 or 4) grandfather died in Gladesville, perhaps I'll be joining him there soon if I continue to select IOZ in the monthly tipping competition.

KH

Note: As always, IOZ is an ETF based on the main ASX index, the S&P ASX 200 index, otherwise known as XJO. The analysis here of XJO is the best way for me to analyse IOZ as it has a longer history, and devoid of any distribution adjustments.
 
The previous post was a bit long, so this is a very short addition:

A longer term monthly chart (source: NABTrade) for XJO shows a recent triple top, with a series of lower lows, and if XJO drops too much more, there isn't too much support until we get to 6000 or so.
Screenshot 2022-10-02 at 12-14-41 Trading - Hang Seng 17222.8 57.0 (0.33%).png


KH

IOZ is an ETF based on the main ASX index, the S&P ASX 200 index, otherwise known as XJO. The analysis here of XJO is the best way for me to analyse IOZ as it has a longer history, and devoid of any distribution adjustments.
 
*** September 2022 could be a fun month for buy-and-hold types (like me). **

participating in the DRP adds an interesting twist ( it translates that lower share price into extra shares in your portfolio )

i went for GEAR because i expect a wave of bailouts ( pivots ) in the coming month to try to save the mid-term elections for the Democrats ( and maybe some other incumbent governments )

if i am wrong i am looking to dip a toe into GEAR around the $17.50 to $18 range ( maybe even a second nibble if it slides below $17 )

good luck

this month could be a bundle of excitement
 
IOZ back on a longer term support line and close to the bottom of the channel. People seem to be pretty bearish out there on the overall economy and financial markets. With Jim Chalmers selling armageddon I have a feeling we might be close to a bottom.


Screen Shot 2022-10-12 at 10.34.35 am.png


Screen Shot 2022-10-12 at 10.35.15 am.png
 
Top