Australian (ASX) Stock Market Forum

Hull Moving Average

Joined
9 June 2005
Posts
99
Reactions
0
Has anybody any views on the Hull Moving Average (a moving average devised by Alan Hull which attempts to overcome the usual lags caused by MAs)? See the link for more details - http://www.ensignsoftware.com/tips/tradingtips72.htm

I read one review which claimed that Hull was effectively using future data to plot his MA. I haven't looked at this in depth yet but wondered whether others thought there is any merit in spending time on it.
 
This is the Metastock code for Hulls M/A

period:=Input("period",1,200,20);
sqrtperiod:=Sqrt(period);
Mov(2*Mov(C,period/2,W)-Mov(C,period,W),LastValue(sqrtperiod),W);

The problem lies in the LastValue function.This function loads the whole data array with the last value of sqrtperiod which ofcourse has been calculated over the entire period of the data array.As such a figure which would change with price action becomes a constant rather than a dynamic.In this way it can be seen as giving a figure--IE that calculated as a future value--as you can see as time goes on the figure would chnage from that which is at the time of calculation accepted as a constant.

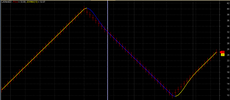
Here is a chart showing the difference.
If I was to show the M/A in 6 mths time it would look totally different to todays plot. It would appear to move.As data used in the calculation in 6 mths time will be different to todays "Lastvalue" ---- Where as the "Normal" M/A would remain in place.
 

Attachments

  • Hull MA.gif
    Hull MA.gif
    29.2 KB · Views: 86
After reading Alan Hull - How to reduce lag in a moving average, I did a math exercise to see if I could remove the 0.5 overcompensation which he left in his calculations, and the point of post is to present a method that shows how to remove that final 0.5 overcompensation. I'm not saying it legit, and I'm definitely not spuiking a new moving average formula. (ewww))

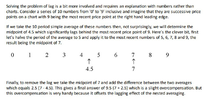
Hull explains his lag reduction method below.

1643855200267.png

A quick summary of his calculations are;

MA10 = (9+8+7+6+5+4+3+2+1+0)/10 = 4.5
MA5 = (9+8+7+6+5)/5 = 7
MA5-MA10 = 7 – 4.5 = 2.5
Final = 7 + 2.5 = 9.5

A centred MA (non-lagging) would have a value of 9, Hull's method give 9.5, that's 0.5 of target.

Hull stops there and I understand why he left 0.5 overcompensation in his calculations. It's because he smooths his data with an WMA of a WMA, which creates more lags yet smooths the data more.

My interest was in getting rid of that final 0.5, and here's a method, I'm not saying that the method is legit, it is a fudge, but it is no more of a fudge than what Hull does in his calculations. Anyway here it is;


Subtract 8 from 9 and then divide by 2 that gives you 0.5.
Subtract the 0.5 from the 9.5 and that give you 9, which is the non-lagging target MA value.
Voila all the lag is gone, well no, not really, and definitely not gone in any real life data (overshoot effect).

Fudge = 9.5 – (9-8)/2 = 9 // Bang on target

Fudge = Final – (Todays_Price – Prevous_Price) / 2

AmiBroker code for all the above math looks like this.

JDtempMA = MA(C,5) + MA(C,5) - MA(C,10) ;
JDMA = JDtempMA - (JDtempMA - Ref(JDtempMA,-1)) / 2 ;

In my opinion WMA() is a better plot than MA(). The WMA is divided by 3 instead of 2.

JDtempWMA = WMA(C,5) + WMA(C,5) - WMA(C,10) ;
JDWMA = JDtempWMA - (JDtempWMA - Ref(JDtempWMA,-1)) / 3 ; // No Lag Baby (pfft n heh)

At the end it's just a math exercise (fudge) nothing more, nothing less. Anyway I just thought I'd dump it here. I do realize that the last thing a chartist needs is another hacked up squiggly line to clutter up their charts. I apologies for the mess. I'm almost certain that Hull (or others) would have calculated that final tweak (I'm definitively not claiming any of it it as original work), and all thanks go to A. Hull for crafting an interesting MA fudge.

1643855365133.png
 
Top