tech/a
No Ordinary Duck
- Joined
- 14 October 2004
- Posts
- 20,453
- Reactions
- 6,514
Hmm I seem to have deleted a database so will miss this week while I clean up my mess.
It's basically the market dynamics/market depth of buy vs sell ratio.. when seller's dissipate then the buyer's gain control (bullish meaning the bulls are in control so to speak) in paying up more for a given stock as demand increases and vice-versa.So If Holders of anything decide to keep their supply and not release it
to others then Buyers will offer more in the hope of purchase.
It's basically the market dynamics/market depth of buy vs sell ratio.. when seller's dissipate then the buyer's gain control (bullish meaning the bulls are in control so to speak) in paying up more for a given stock as demand increases and vice-versa.
I understand that, but how do you get supply?This is standard thinking —- not my own.
I personally choose to look only at supply.
Demand can be massive but if supply is overwhelming then you won’t see it in
price increases.
I personally don’t believe bulls control anything.
Supply however again I personally believe controls everything
if it withdraws then price rises
if it appears then it can turn a 100% increase back to where it started
in a session.
Look at gluts of ANYTHING —- Supply
plenty off supply overwhelming demand sometimes crushing any value.
shortages are exactly the opposite. Can’t get it then demand must pay more for the limited
availability.
I again personally find it easier to trade around supply.
I’ve seen massive demand crushed in 24 hrs by the emergence of supply at a price.
The constant fluctuations of supply develop visually on a chart. Leaving patterns and clues
that we can anticipate future price action. We can see opportunities develop and disappear in front
of us.
Extremes ( of various magnitudes ) move markets. Again they can often be seen clearly on a chart before
they are seen or heard of by the masses.
Back again when I get some charts.
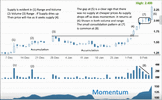
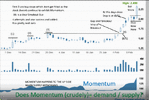
Hi Tech. A question from the Dept of Dumb. I am trying to think where I can see supply. Questions are on the graphic. I appreciate that many factors together would be needed to determine supply but I am thinking momentum may be of use. Apologies if I am off the mark I am not a trader.The constant fluctuations of supply develop visually on a chart. Leaving patterns and clues
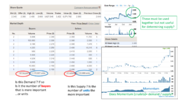
Hi Tech. A question from the Dept of Dumb. I am trying to think where I can see supply. Questions are on the graphic. I appreciate that many factors together would be needed to determine supply but I am thinking momentum may be of use. Apologies if I am off the mark I am not a trader.
View attachment 120042
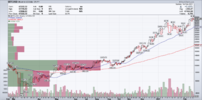
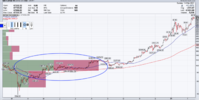
Thanks Duc @ducati916. I am not familiar with the side bars on the chart I would guess they show proportion between buy (green) and Sell (red) against the price at that bracket. But I cannot figure the magnitude - what drives the length of the bar.
I see you mention hidden orders in US. Does that exist on ASX orders , I am wondering if conditional orders are visible
Hope lunch is / was great @tech/a
Thanks for sharing guys. Enjoying the discussion .

But that supply demand is also twisted by conditional orders so you might have huge demand or supply appearing within ms of a price threshold, especially so in the age of bots and qants
Don't want to tread on Tech's toes in his thread but from personal experience, I've certainly placed orders on less liquid stocks at a price where there's no order visible on the other side (buy / sell) and had them immediately filled.I see you mention hidden orders in US. Does that exist on ASX orders

And also related is the presence of orders as scaling up or down levelsDon't want to tread on Tech's toes in his thread but from personal experience, I've certainly placed orders on less liquid stocks at a price where there's no order visible on the other side (buy / sell) and had them immediately filled.
How that works in a technical (computing) detail I've no idea, Tech can probably explain that one far better than me, but I've seen it happen too many times to be coincidental indeed in some cases I've actively tried to work out exactly where those orders are in terms of price limits.
When reading volume we are interested in the momentum of the trade.
we need 4 components
RANGE
POSITION OF CLOSE AND OPENS
PATTERN
VOLUME TRADED
most things on their own have little value
reading all 4 changes the face of a chart from a graphical representation of
market constituents to a short story on the relationship those constituents have
with the ticker being traded —- at all timeframes.
The more liquid the trading the shorter the timeframe that can be used to build the story.
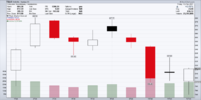
In the context of the day —-yes
Hi Tech. A question from the Dept of Dumb. I am trying to think where I can see supply. Questions are on the graphic. I appreciate that many factors together would be needed to determine supply but I am thinking momentum may be of use. Apologies if I am off the mark I am not a trader.
View attachment 120042
I've certainly placed orders on less liquid stocks at a price where there's no order visible on the other side (buy / sell) and had them immediately filled.
Hello and welcome to Aussie Stock Forums!
To gain full access you must register. Registration is free and takes only a few seconds to complete.
Already a member? Log in here.