
- Joined
- 17 October 2012
- Posts
- 707
- Reactions
- 1,389
1st off
"The Ducati Blue Bar Strategy" bears no resemblance to any strategy that I have previously posted & in no way mimics or uses any part of the "SuperTrend Strategy" or infact any of the ideas @peter2 has posted about. The idea has been coded from Duc's previous post. The two indicators are indicator I've never used before so the strategy is even completely new to me as well. Any resemblance to any other strategy would be coincidental.
Volatility & Volume
Newt, the Duc described using two indicators to measure "Volatility & Volume" the real drivers of a trend - meaning we enter a trend on volatility & volume - getting off when the trend turns. There are so many indicators that measure both of these, the trick was getting two indicators to work in unison. Once I got the parameters nutted down it was as simple exercise in comparing today's results to the previous day. The downside is that we can jump in & out of positions quickly giving the positions no latitude for the daily price fluctuations of the markets.
The two indicators
It would be unfair for me to mention the two "off the shelf indicators" because even having the same indicators the parameter setting can make or break the profitability or performance of the strategy. If others are interested they will do their own research to find indicators that will work for them.
Indicators
Getting into a trend is not that difficult using an indicator, using two is sometimes better & that's what I believe Duc's message was. Getting out of a trend & timing the exit is a little more complex but as the Duc didn't elaborate on an exit strategy I just used the reverse of his entry condition.
Mental toughness
I've used this analogy before referring to Peter Brock who won the "Bathurst 1,000" nine times. Imagine, giving a good strategy to someone else would be the equivalent of giving Peter Brock's winning car to the same person. Does anyone honestly believe they would be able to win Bathurst even once ? It’s not the vehicle, it's not the strategy it's the 'mental toughness' that is the real decider if you'll be a winner or not.
Repeat it - till it sinks in
It's the very reason why we need this to sink in: "A trading system is usually most effective when "implemented consistently". One problem frequently encountered by individual traders is the "difficulty" in following a system. Sticking to a system requires discipline, and discipline is often difficult to maintain in the heat of live market action, where "emotions" can rule the day, and a trader may be tempted to second-guess his or her system".
Skate.
")

how would I feel about missing out on MCT?
PGL closed 42% up
I bought, PPS, CWY, VUK and MCR on 23/03 or 24/03 from memory

The market provides plenty of learning opportunities if you're looking for them. Increases in price, volume and volatility may indicate further price increases. Sometimes it works and sometimes it doesn't. Managing all the opportunities that we undertake in a profitable manner is key to success.
Intruiging, but thanks for extra detailI thought I had read back for mention of drivers for Duc's thinking, but will have to do so again and see what was missed or not understood. Somehow it seems frustrating to see such wonderful and detailed weekly strategy summaries, without grasping the broad and finer detail of what the strategy is doing. However can also understand your concern and reticence to be spoon feeding people Skate.
aGGGGHHHHH!!! - I'm still a fail!
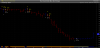
When you get a chance Skate, can you look at the NCZ chart around the 6th March? Am intrigued why the blue bars didn't turn red?
@Newt
Indicators
Systematic traders use indicators to make trading decisions & we all tend to fall into the trap of using our "pet" indicators. Trying out new indicators & ideas may lead us to a better way of thinking about market timing.
Tools
Some traders know, (Duc included) that using one tool is sometimes not enough, using a combination of indicators has the ability to improve any strategy. @peter2 made a great comment confirming some signals are accurate some of the time.
Peter's comments
"The market provides plenty of learning opportunities if you're looking for them. Increases in price, volume and volatility may indicate further price increases. "Sometimes it works and sometimes it doesn't". Managing all the opportunities that we undertake in a profitable manner is key to success"
Skate.
Somehow it seems frustrating

There are myriads of 'indicators' & you can suffer indicator overkill and just end up confusing yourself.
@Newt,
1. I pride myself in exiting a position quickly to protect profits or to limit my loses. Trading a weekly system can sometimes be "frustrating" because of the inherent lag, at other times trading a weekly system can pay dividends by allowing for the daily gyration of the markets to settle by weeks end.
2. I was thinking like a "crazy person"
In hindsight I felt "frustrated" not being able to find a better solution that would have minimised the loss in my open profits. The market fell so sharply & so quickly I've come to the realisation that my systems did their best. The "crazy man" (my inner self) simmered to the surface "thinking" I have to get "MY MONEY BACK" forgetting the all important mantra: "Open profits belong to the market, closed profits belong to you"
3. Trading was looking great this Financial year
The "virus" has affected so many lives as well as the markets. I was having a good year taking 8 months to accumulate a good deal of open profits only to see some of it evaporate over a two week period.
4. Small snippet
This is a small snippet of my "current financial year" (my equity curve) The large drop wiped off nearly 70% off my open profits. The crash came so swiftly, something I had not experienced in my 5 years of trading. But the good news is - I'm fighting my way back.
View attachment 102160
5. FYI
I don't care about the mantra -- I want "MY MONEY BACK" & I won't rest till I have it back.
Skate.
Thanks Duc, a nice slightly alternative view to @Skate1. This is the conundrum: the grail of maximising profit. (a) Exit too early, lose potential profits, (b) exit too late, lose paper profits. There is no perfect answer. The answer is: psychologically which hurts less; (a) or (b). I am assuming that in backtesting, your answer was (b) but not for the psychological reason, rather, the testing suggested that (b) was the more profitable. Unless you had the data for 1987, or 1929, nothing else has really matched this decline for speed.
For completeness I am an (a) person. Why? Once that profit is in my account, it is mine. I can always re-enter a trade, as a new trade. The other risk management related to exits is I tend to exit long positions on market conditions, rather than on individual stocks. That is quite a significant difference. Why? I started trading in March 2000.
2. Frustration is important. It leads to some hard thinking.
3. You need to consider a system that embraces (a) more and (b) less. The balance will of course be extremely tricky. But you will sleep ever so soundly at night once you find it.
4. It is brutal and I had pretty much the same experience in 2000, except that was not 'open profits' but starting capital.
5. Beware revenge trading (not really aimed at you) a psychological trap for novices.
jog on
duc
1. This is the conundrum: the grail of maximising profit. (a) Exit too early, lose potential profits, (b) exit too late, lose paper profits. There is no perfect answer

Gold in those last 2 posts thanks Duc2. Frustration is important. It leads to some hard thinking.
jog on
duc
Have just thought I'd like a "Pool" indicator.
By pool, I am thinking of all the ASX sectors combined with the intention of understanding if the market liquidity generally is substantially increasing or decreasing at any particular time. A live indicator. Is the money flooding in or draining out or just milling around? I guess it could also be used as a current sentiment indicator, bullish or bearish.F.Rock
Skate, can you look at the NCZ & PGL

@frugal.rock there is already an indicator to measure if "money is flooding in or draining out" The "Indicator" is called the "Buy and sell pressure indicator" with a smoothed Histogram. The indicator is the work of Karthik Marar & is freely found here: http://karthikmarar.blogspot.com/2012/09/buying-and-selling-pressure-indicator.html - "there is no reason to reinvent the wheel"
A picture paints a thousand words
Study the "Buy & Sell" indicator in action - better still, download the indicator & play with it.
View attachment 102181
View attachment 102182
View attachment 102183
Skate.
Skate, how the h#ll have you got our equity curve heading up again so quick. Can I ask, are those mainly daily positions/systems that have helped you nudge up of DD, or still a majority of weekly ASX?
Skate, how the h#ll have you got our equity curve heading up again so quick
@Newt. I totally agree, I snagged $79k on Tuesday only to give $55k back on Friday, but overall it was a good week all things considered. Skate.
Thank you for the good work you are doing Skate. Markets can be scary in times of big falls (like at the end of 2018) and crashes like this one. I missed the bulk of the recovery that started in 2019 due to staying out of the market because of the fear , having liquidated late 2018. Should've stayed glued to this thread and those of Peter2's as you guys were investing right from the start of 2019 recovery. Although we don't know if the bottom has been reached I think it gives me enough confidence to have a nibble here and there. Cheers and off to do some research to find if there is any diamonds in the rough...
We use cookies and similar technologies for the following purposes:
Do you accept cookies and these technologies?
We use cookies and similar technologies for the following purposes:
Do you accept cookies and these technologies?