
- Joined
- 3 May 2019
- Posts
- 6,481
- Reactions
- 10,322

G'day Skate,
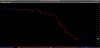
Your NCZ chart shows a change from red bars to blue around early March then a run of blue despite the price trending down.
I can see the flutter that starts the first blue bar, and maybe 1 or 2 more, but I would have expected red bars on and down?
It picked up a very good short trade though?!
Makes me wonder what sort of trading took place to trick the system to stay blue?
Cheers.
I am now onto Prospa Group PGL.
Show me the blue bars...!
NCZ seems to be crackin on, but I'm out.
Thanks for your efforts Skate.
F.Rock


There seem to be some correlation between the Blue Bar and my system. If so, NXT and possibly TNE & NAN could at the end of the run as well.
There seem to be some correlation between the Blue Bar and my system. If so, NXT and possibly TNE & NAN could be at the end of the run as well.
@Country Lad, thank you for your additional comments & would you care to elaborate why NXT "could at the end of the run", is it because of the pullback ?
Tell me more
You are also implying that "TNE & NAN" could at the end of the run as well - would you care to explain further ?
Indicator or gut feeling
I'll be very interested to see how your predictions goes. "The Ducati Daily Blue Bar Strategy" sells only after the first "Red" bar which is the signal bar - even if the next bar after the signal bar is "Blue" bar.
For comparison
Would you be kind enough to explain your system (in general terms) & throw up a chart or two for comparison please. If I'm interested other would be as well.
Skate.

Hi @Skate, Thank you for your good work and @peter2!The Ducati Daily Strategy
Hi @Skate, Thank you for your good work and @peter2!
Excuse my upcoming question since I am a newbie to this forum and to ASX trading; You mentioned "The Ducati Daily Strategy" and I can see it named in the charts title, is that a charting tool created by you? Is it something we can lay our virtual hands on


In early trading
@Country Lad is spot on the money about NXT in early trading we have a "Red" signal bar, well done. If there is still a "Red" Bar at the close today it will be sold at tomorrows open.
View attachment 102086
Skate.

So the exit is taken today, even if the new bar is blue. How does that compare to exits (in regards to sensitivity) on your other systems?
NXT was sold on the open today, charts & explanations to follow in the next post showing the execution of the sale & the trading result of NXT.


"The Ducati Daily Blue Bar Strategy"
Backtest results for the 2019 calendar year (this strategy has not been developed )
View attachment 102118
The strategy isn't too shabby
The low system drawdown is very pleasing.
Skate.
Had a look at systems ages ago, this company had loads on offer:
View attachment 102113
It’s come to our attention that a number of our clients and other interested persons may have some questions regarding systems trading at Striker, and systems in general. While we have covered some of the following topics in the past, we feel that given the increasing interest in the systematic approach to trading futures and trading in general, it is only appropriate to revisit some of these themes.
Is system trading a valid approach to trading futures?
We feel certain that it is, and that it is reasonably safe to say that most professional traders will trade using a system of some sort in trading the futures markets. A system in this regard can be any strategy ranging from simple entry and exit criteria, money management rules, the use of stop losses to protect positions or lock in profits, to the more complex use of technical indicators and mathematical formulae. A system provides a consistent and logical approach to trading. Whether simple or complex, a trading system is usually most effective when implemented consistently. One problem frequently encountered by individual traders is the difficulty in following a system, whether their own or a professional developer’s. Sticking to a system requires discipline, and discipline is often difficult to maintain in the heat of live market action, where emotions can rule the day, and a trader may be tempted to second-guess his or her system. Striker’s clients enjoy the disciplined execution of system signals, since our professional operations team has been specifically trained to faithfully execute these strategies.
I have purchased a system which is currently being traded at Striker. What is the relationship between Striker and the system developer?
One of our goals at Striker is the unbiased evaluation of system performance. To this end, Striker has no financial ties to systems developers, nor does Striker have any in-house systems. Our financial independence allows us to be objective in evaluating systems. The leasing or purchasing of proprietary systems is a matter between the client and the developer. While we strive to work with reputable developers of robust and legitimate systems, we see our role as primarily one of service, execution, and the accurate reporting of information. To this end, we do not tamper with system signals, but faithfully strive to execute them in a timely fashion. We then report the actual trading performance at striker.com.
Help! The system I’m trading isn’t doing as well as I thought it would. What can I do?
While it is always preferable to see winning trades in one’s account, the fact remains that the futures markets, like other markets, tend to fluctuate. Futures markets can also be more volatile than equity (stock) markets. Trading futures using a systematic approach offers specific advantages (such as establishing rules of risk and money management), but does not guarantee success. Nevertheless, merely because a system is struggling at the moment does not mean that it will not offer positive returns over the long run. A number of systems traded at Striker have gone through periods of “draw downs”, but have gone on to make money for our clients. For example, the Compass S&P day trading system, which trades the S&P futures on $30,000 has returned over 235.29% since January 2000 as of April, 2007. However, the system, which can also trade the e-mini S&P on $5000, actually lost money in 2004, but went on to continue to return profits in 2005. In its trading life at Striker, it has averaged over 32% a year, as of April, 2007. In other words, patience and an accurate assessment of one’s financial situation are key factors in systems trading. However, Striker’s professional staff is happy to work with clients in terms of recommending alternatives if a system appears to be underperforming.
Why are Striker’s results different than the developer’s?
Striker reports only actual trading performance, where a number of developers report hypothetical performance. The difference is that hypothetical reports do not represent actual account activity, but rather represent a computer generated snapshot of the system’s trading signals. In the case of systems traded at Striker, these signals are generally identical to those generated in our operations center, but where a hypothetical report begins and ends in the computer, Striker takes these signals “live”, and in to the hurly burly of real market trading conditions, where they must compete with other traders’ orders. Market conditions can change very rapidly, and even with Striker’s superior execution and expertise, fill prices can vary depending on the market. The difference between an ideal price and the actual price fill is known as “slippage”, and is an inevitable component of futures trading. Nevertheless, Striker’s experienced team works hard to get the best price fills for our clients, and our results always reflect any slippage.
I’ve been looking at systems on the Internet. There are quite a variety of them. Can Striker recommend one in particular?
In the client section at http://www.striker.com, we keep actual trading performance records for systems that have traded or are trading at Striker, with commissions included. These records represent real trades for our clients’ accounts. We feel these records can be highly useful in evaluating and choosing a system. However, we are aware that there are many programs available for sale or lease on the Internet and elsewhere that have not been traded at Striker, and we recommend that you engage in careful due diligence in evaluating these systems and their developers.
For example, it is important to do your homework in looking at the developer’s background. What is their trading and business history? Are they registered with a regulatory body such as the NFA? Do they have a good business record? Have they had complaints registered against them with the Better Business Bureau, or other consumer protection agencies? These are all questions to consider when investigating a system developer.
There are a number of important questions to ask when evaluating a given program’s trading record. Are the trades shown actual, or hypothetical? If they are hypothetical, what methodology was used in implementing the hypothetical model? Has the model attempted to accurately reflect a real trading environment, with slippage and commissions factored in?
Finally, if you are looking for a specific recommendation when looking at systems traded at Striker, don’t hesitate to contact system specialist Dan Neenan.
I see some of the systems traded at Striker are struggling. Do systems ever completely fail?
The systems you see at Striker are not “ours”; we do not sell systems. These are third-party trading programs for which we are doing the execution. In many cases, they are systems that clients have purchased on their own, and have decided that they prefer to have Striker execute the trading for them. We only show trading performance for systems actively traded at Striker. Should a system show little or no promise at all over a period of time, our clients are likely to stop trading it, and the performance record for the system would end. So to answer the second qustion, systems do on occasion chronically underperform. Futures trading is inherently risky, and while systems in general are developed in order to manage risk and improve a trader’s chances of obtaining a successful outcome, traders should nevertheless trade using only risk capital.
My system is losing money. What should I do?
At Striker, our priority is your comfort in trading. While we don’t advise that clients abandon a system merely because a series of losing trades, we are here to take your direction in trading your account. If you feel uncomfortable with the direction of your current trading approach, we recommend that you stop trading, take a deep breath, and look at your options in terms of exploring an alternative or more conservative strategy.
jog on
duc
@ducati916, your "The Ducati Daily Blue Bar Strategy" was coded from your post & it was clear for me to understand. The first "blue bar" is the signal bar (the white arrow) & we buy on the "next daily blue bar" at the open (the white square). The position is held till the first "red bar" & sell that position on the open on the next "red bar". It's a simple strategy I have to admit.
Explanation of the bar colours
I've used @peter2 idea of colour coding the trend with "Blue Bars" so it's simple to follow along by looking at the charts. The "Blue" bars meets Duc's two conditions & the "Red" bars are when Duc's conditions "are not met" - the strategy is easy to follow as there are only two rules.
2 Rules
1. Buy on the next bar after the signal bar - the 1st "Blue" bar &
2. Sell on the next bar after the signal bar - the 1st "Red"
Questions
1. "So the exit is taken today, even if the new bar is blue ?"
Correct, by selling in the pre-auction we don't know what the colour of the next bar will be. If the strategy gets it wrong we can re-enter the position on the next "Blue" bar.
2. "How does that compare to exits (in regards to sensitivity) on your other systems?"
To be honest there is no fancy exit strategy other than to exit on the first bar after the "Red" signal bar. The "Red" bar just means the "entry condition is no longer being met". There is no comparison to any of my trading systems when it comes to exiting a position. All my trading systems will hang onto a trend as long as possible giving the position some wriggle room along the way whereas "The Ducati Daily Blue Bar Strategy" is clear cut - it either a "Blue" or "Red" bar.
Bar colour
1. A "Blue" bar means = BUY whereas
2. A "Red" bar means = SELL
Duc's two key words.
"Volatility & Volume" are the two inputs that I get to use that are the real drivers of a trend. Duc, you suggested using only two indicators to guide when it's optimal to buy & sell. I took your words to mean that we enter a trend on volatility & volume - getting off when the trend turns.
One position down - seven positions to go
NXT was sold on the open today, charts & explanations to follow in the next post showing the execution of the sale & the trading result of NXT.
Skate.
It would be good to know what volume and volatility conditios you're using Skate?
Even a general description. I thought you might have been using Supertrend or something ala Peter 2 but see now you've created custom "Duc" criteria.


We use cookies and similar technologies for the following purposes:
Do you accept cookies and these technologies?
We use cookies and similar technologies for the following purposes:
Do you accept cookies and these technologies?