
- Joined
- 27 April 2006
- Posts
- 523
- Reactions
- 1
OXR ENTRYBarney said:Hi Coyotte, I know you are an OXR "fan", Can you detail the way you "read" the chart for us uneducated....Cheers Barney.
Moderator's Note- This post is by Barney: Hi C, Some good insight in these posts. Very informative for those trying to learn more about this stuff .......Keep 'em coming, Barney.coyotte said:OXR EXIT
Count Back STOPS are done the same way :
From the recent high bar count back untill U find a bar with lower low than the low of the high bar = CB2 -- from CB2 find the next bar with a lower low = CB3.
...........
........
.......
Sept --- B/Bs are breached ,ADX diverging & at a low level , along with upward pointing tails on candles.
Current --- a half mast bear flag is forming , along with up tails !!!
These along with Twiggs Money Flow are the only indicaters I use and only when Specs/Traders are in the market.
Will post a entirely different stock MBL next .
disclosure : SHORT position Thurs --- 1/2 Long Hedge Fri (cover weekend)
RichKid said:Moderator's Note- This post is by Barney: Hi C, Some good insight in these posts. Very informative for those trying to learn more about this stuff .......Keep 'em coming, Barney.
PS Re the specs/traders mentioned above; Just to make sure I have this basically right Do you mean you ONLY trade when the specs/traders are involved? ie either they are just re-entering the market - Entry points using C/B + positive move on sp? AND look to exit soon after the upward momentum diminishes ie C/B with negative sp move and/or after an unsustainable uptrend as described with bollinger curves etc OR will you still "consider" a trade without any obvious volatility, but maybe based on other signals??
Coyotte said:Barney :
Most of my trades now are initiated by either a " rising triangle " or a " bull flag " for a long position --- the reverse of these two patterns for a short position.
C/B is not applicable to these types of trades , they are usually entered around the 2/3 point of the pattern development . ---- this is short term price target trading --- C/B is used for confirmation when some other method of entry is signaled eg: Trend Line Retrace -- Bollinger Bands breach + retrace --- MA cross over ,etc, etc .
Those where the type of trades I moved on to AFTER coming to terms with TREND TRADING .
Will post a graph of SBM -..............
..............
..........
.......
Cheers
Moderator's Note- This post is by Barney:coyotte said:SHORT TRADING :
Below is where the ASX approved
http://www.asx.com.au/investor/education/basics/short_sales.htm
go to the r/h side of the page -- midway down -- >download(TXT 15 kb)
The Risk/ Reward Ratio of Short trading is far too against the trader compared to the R/R Ratio of Long ...............
,.,,,,,,,,,,
........
........
Be careful of high Volume on a short , it is often the final sell off ----- same when approaching a major support level , generally a good time to bail out.
Cheers
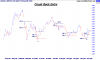
coyotte said:LHG STIRRUP
Stirrup Pattern of LHG current
After a stock has begun to rebound from a severe decline
Starts with the formation of a upward sloping triangle
Trade can be entered early as price target trade -- the depth of the triangle is added to the top line of the triangle = EXIT
If price continues past the target -- the new target becomes -- the Base of the triangle to the Top of the previous High x 2
Before this stage is reached the stock would probably have turned into Tread Trade and could be treated under those rules .
Disclosure: hold a long position, will add to if triangle target is exceeded.
Will show the same pattern with ROC tomorrow.
coyotte said:Barney :
The STOP for a Rising Triangle is ussually calculated by measuring the "Base to the Top Line of the Tri " this gives the Target Price .
In LHG's case 2.61 to 2.81 = .20 = Target Price 2.81 + .20 = 3.01.
From any point along the Bottom Trend Line of the Triangle project down that .20 and place a parallel trend line -- that line is the STOP --- UNTILL the Target Price is reached -- in this case being a Stirrup Trade , if it pans out , and the target is exceeded then a riseing C/B STOP would take over.
Was about to to close the position today , as it became obviouse that the close would be around 2.78 (today's stop ) getting to risky; When I recieved a E-Mail Alert from Steve Saville , a Gold Analyst I hold in great respect -- that basically the down side risk to POG was far less than the up side potential , for the MOMENT --- so I'm still in there
Will be posting a interesting situation concerning OXR and patterns (current )-- had some feed back from HotCopper & IC forums on this . --- never seen this situation before in a stock .
Cheers
these trades generally have a 70-80 % S/R -- looks like this could be in the 20/30 % lossing Group
THREAD CLOSED
We use cookies and similar technologies for the following purposes:
Do you accept cookies and these technologies?
We use cookies and similar technologies for the following purposes:
Do you accept cookies and these technologies?