Australian (ASX) Stock Market Forum

BMW's trading journal

BMW

Joined
28 March 2015
Posts
13
Reactions
22
Hey, I'm looking to make money trading (long-term..)

I was told by somebody on here, that maybe starting a journal on here might be good for me seeing as I don't trade $5000 or anything else like that until I can consistently make money paper trading. I understand that paper trading is not "real" trading but like I said I'm not going to risk blowing up my account - shame I can't start with a small account and grow my account, going forwards... anyways, after watching these videos;


I've decided to use a 50 day moving average, the MACD and ADX - this isn't the first time in the markets, nahhh I was stupid and blew my all my savings - just reading hurts but you learn from mistakes I suppose? Anyway, this meant stop seriously trading for a 4 to 5 years when it comes two entries and exits I'm going do it the right way this time and only going to look to take a long positions, when set-up happens...

Price above 50 day moving average
ADX above 25
MACD signal line on the upside

And only take a short position when..

Price below 50 day moving average
ADX above 25
MACD signal line on the downside

Unlike when I blew my account and savings with it - I will draw up support and resistance lines/ swing highs and swing lows - the plan is to set my stop loss at a recent swing high or swing low and look for a 1:2 take profit set-up... cos I'll set stop and take profit levels, chasing profits, getting out of trades early won't happen - unlike last time - well that's the plan.
 
Last edited:
Hey, I'm looking to make money trading (long-term..)

I was told by somebody on here, that maybe starting a journal on here might be good for me seeing as I don't trade $5000 or anything else like that until I can consistently make money paper trading. I understand that paper trading is not "real" trading but like I said I'm not going to risk blowing up my account - shame I can't start with a small account and grow my account, going forwards... anyways, after watching these videos;


I've decided to use a 50 day moving average, the MACD and ADX - this isn't the first time in the markets, nahhh I was stupid and blew my all my savings - just reading hurts but you learn from mistakes I suppose? Anyway, this meant stop seriously trading for a 4 to 5 years when it comes two entries and exits I'm going do it the right way this time and only going to look to take a long positions, when set-up happens...

Price above 50 day moving average
ADX above 25
MACD signal line on the upside

And only take a short position when..

Price below 50 day moving average
ADX above 25
MACD signal line on the downside

Unlike when I blew my account and savings with it - I will draw up support and resistance lines/ swing highs and swing lows - the plan is to set my stop loss at a recent swing high or swing low and look for a 1:2 take profit set-up... cos I'll set stop and take profit levels, chasing profits, getting out of trades early won't happen - unlike last time - well that's the plan.


BMW is a short term feel good brand these days, they don’t age well.
 
How about posting a historical chart showing your perfect setup with the entry points, initial stop loss and possible price targets marked.
Don't copy the examples in the YT vids. Find one in your own charts because this is where you're going to find them in the future.

Then show us how you calculate how many shares/lots to buy in your example.

The idea is to create a process that you can repeat over and over. It'll take quite some time for you settle into a consistent process. There'll be lots of changes along the way as you find what works and what doesn't work for you. If you don't start then you'll never get there.
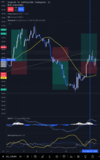
Not sure if this is what you mean, or it's just way too simplistic but from my point of veiw this meets all my entry requirements...

TradingView_Screenshot_1668155854990.jpg

Price is above the 50 day moving average
ADX has crossed the 25 level
The MACD signalling a long set-up.

As for my stop loss, it's the bottom white line and the take profit, it's the top white line. Oh calculating shares and lot sizes, that kinda I'm crap at, that's something I've got to improve upon and given time I will do. Anyways, I agree when you said the idea is to create a process that you can repeat, repeat and repeat - I agree, being consistent is the main plan here and getting there won't happened overnight - that makes 100% sense.
 
Last edited:
Thanks for the chart and the additional edited comments.

You've posted an intra-day chart of a volatile commodity. The good thing about this market is that you can trade it with leverage. This is useful with small accounts. The bad thing about trading leveraged markets is that it's very easy to lose the lot. Especially if you can't calculate suitable lot sizes for your trades. Your admission that you're "kinda crap" at this important task probably explains why you lost the lot previously.

I'm willing to provide more criticism but none of it would be complimentary. I don't want to totally crush your trading aspirations.
I'll reply to any questions you post.

I think your right that not fully grasping the importance of calculating suitable lot sizes is definitely a reason why I've not succeeded making money long-term. Going forward getting a full grasp on what you need to know is very important and would help my cause immensely.

I know that picture isn't talking your language, I even acknowledged that in my previous post. It would completely surprised me have anything good to say about about that chart - that is clear and perfectly okay - btw don't worry about "hurting" my feeling, besides you not constructively criticising me hurts more.

I want an informed critique on what I should focus on going forwards.

I acknowledge that to make money long-term isn't easy, but with effort and hard work it's possible. I'm happy for you to tell me these harsh truths, if it helps me get towards where I want to be.
 
How about posting a historical chart showing your perfect setup with the entry points, initial stop loss and possible price targets marked.
Don't copy the examples in the YT vids. Find one in your own charts because this is where you're going to find them in the future.

Then show us how you calculate how many shares/lots to buy in your example.

The idea is to create a process that you can repeat over and over. It'll take quite some time for you settle into a consistent process. There'll be lots of changes along the way as you find what works and what doesn't work for you. If you don't start then you'll never get there.
This post broken down into steps.

1. Post a chart that is relevant to me, and on the correct time frame that suits my trading style- I'm looking to hold stock anywhere from 1 day to 1 week, so short term swing trading suits me - which would be best? The 4 hourly chart, or daily chart? I'm not completely sure about this.

2. Draw in support and resistance lines, supply and demand zones, trend lines and important candlestick patterns. This will help me understand price action and when I should enter the market.

3. The use the above to help get an idea where to set my initial stop loss and take profit levels. Yeah, the stop loss might change but you just want to know where the stop loss will initially be positioned.

4. Set your initial take profit levels too.

That makes complete sense to me, unlike the following...

"Then show us how you calculate how many shares/lots to buy in your example" peter2

I need help to understand exactly where the process of calculating how many shares last lot to buy fits into the above? I understand that it's important to the whole process but look like to know why it is important, does that make sense? I understand that this is very important but I'm just not sure where to start.

Please help me understand the importance of being able to calculate how many shares/lots to buy, how do I this correctly and constantly?
 
Last edited:
Thanks for understanding and your willingness to improve your chances for success. IMHO you need to learn a lot more about the markets you wish to trade, the indicators that you think may help and of course, position sizing. Of all these, position sizing is the easiest to learn. It's also the most important aspect to get right.

Looking at your chart I assume you are going to buy at 88.10. As this is the point that all your indicators align. You indicated SL is at 85.50.
The trade risk is the difference (88.10 - 85.50) = 2.60.

You'll need to know the contract specifications for the market you're going to trade. These specifications vary between brokers. Crude Oil is a futures market. You can trade it through a futures broker or through a CFD provider that bases it's pricing on the futures market. The original Crude Oil futures spec's states that 1 lot represents 1000 barrels of oil. There is now a mini futures version that uses 100 bbl.

If you're using a CFD broker like MT4 (MT5) then you must know what their contract specifications are for every market that you intend to trade. One of my MT4 brokers trades oil with one lot as 1000 barrels of oil, while another broker uses 100.

In your example with the trade risk at 2.60, one lot could be worth $2600USD or $260USD depending on the contract specs of your broker. This makes a huge difference wouldn't you agree.

With the introduction of the mini contract (100bbl) most MT4(5) brokers are using 100 for crude oil. You must check this before you trade.

Let's assume the specs for crude oil is 100 and is in USD. Your trade risk is $260USD. If your account is based in AUD then this means you're risk is increased as AUDUSD is only 0.66 now. Your trade risk in AUD is $260/0.66 = $394 AUD.

If you only want to risk $20AUD in this trade then your lot size must be 20/394 = 0.05

-------------------------
Many futures markets like oil have an open pit session where most of the days volume is done even though the electronic market is open almost 24hrs.day. The world's financial markets have three main session during the day. Aussie/Tokyo, UK, and US sessions. Most of the volume is done during the US session but most of the day's price movement occurs in the overlapping session of the UK/US markets. The oil market has a weekly report from the US EIA detailing the US oil stockpiles. This news moves the market prices. OPEC meetings and statements move the oil market. These news events can happen at any time even over the week-end. Are you willing to hold a trade in a leveraged market over the weekend when anything can happen?

--------------------------

I hope this example shows you how much you have to learn before thinking about trading in leveraged markets. Equity markets (shares) are much easier to calculate position sizing but require more money as there's less leverage available.
 
Replies to your points.

1. Post a chart that is relevant to me, and on the correct time frame that suits my trading style- I'm looking to hold stock anywhere from 1 day to 1 week, so short term swing trading suits me - which would be best? The 4 hourly chart, or daily chart? I'm not completely sure about this.

We're not restricted to one timeframe. Most profitable traders I know use several timeframes (two or three). One TF is used as their trading TF, a larger TF is used for trend bias and a smaller TF is used for trading execution.

Three TFs gets a bit tricky but two TFs are easily managed. If you wish to swing trade then I'd suggest you start with the daily TF as your trend guide and then use either the 1hr or 4hr as your trading TFs. When your daily TF indicates that the trend is up then you're looking for setups to go long in the 4hr or 1hr charts.
2. Draw in support and resistance lines, supply and demand zones, trend lines and important candlestick patterns. This will help me understand price action and when I should enter the market.

Are S/R levels important to you? If they are then which ones are important. They are for most traders as they indicate levels where price swings continue or reverse. I suggest you start looking at the previous day highs and lows, and the session highs and lows.

If you find they have no value then dump them. Show only important items on your charts.

3. The use the above to help get an idea where to set my initial stop loss and take profit levels. Yeah, the stop loss might change but you just want to know where the stop loss will initially be positioned.

The initial Stop Loss is used for position sizing and a disaster (must sell) exit trigger. When a trade starts well or even poorly you may move the iSL to reduce risk in the trade.

4. Set your initial take profit levels too.
This is done to help evaluate if the potential reward is worth the initial risk. If the potential reward is not enough because there's a strong resistance level just above then don't start the trade. Wait to see what happens at the R level and assess your next opportunity.
 
I've spent some time trying to show you that here's a lot to learn about the financial markets before you should trade them. We can trade them in complete ignorance and get lucky in the short term but eventually we'll lose the lot if we don't know enough about the risks present in every market.

Keeping our initial risk very low using conservative position sizing will keep us safe while we learn how to be profitable. Once we've learned how to be profitable we can increase our size to earn more profit.

It would be instructive if you read and understand what happened in the "Trading Turtles" experiment.

Before I comment on your chart and choice of indicators I'd like you to review your 1hr charts spanning more than one week. Look at the big price swings that happened during the week. In some weeks there may be one huge swing, in others many smaller swings. You should be looking at these swings thinking about how can you find them at the start of these swings. This is where you might like to include some indicators. Do the indicators help you get into the price swings early enough to get your desired 2:1?

Does the MACD help you? Do the DM+/- lines help you? Does the ADX help you?
 
If you want to learn swing trading I suggest reading everything published in the right hand margin of this site...
https://stockbee.blogspot.com/
Krisjan Qullamaggie's youtube videos on swing trading are also very good although some are a bit long. There is a also very good summary video of Krisjan's trading strategies in there.
 
Ok since I posted here last weekend, I've stopped using the macd and am just focus on the moving average and the 3 components of the ADX - also I'm not relying heavily on the indicators to tell me when to enter and exit the market but rather confirm what the price action is telling me - I'm not blindly following what the indicators are saying, if price action is telling entering a long position is the way to go - let's say a resistance level is broken on decent volume and all my indicators point to a long position... everything is pointing towards me taking a long position on this trade.
 
Last edited:
Top