Australian (ASX) Stock Market Forum

Ho hum the latest unemployment figures are out courtesy of the ABS.
1649903046172.png
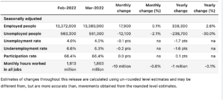
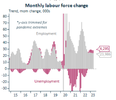
Net 18k new Jobs, unemployed people down by 12k, the - so where did these extra 6,000 employed people come from?
Underemployment went down by 0.2%. and yet the Unemployment rate stayed the same.
Must just mean more peole looking for work.
And yet there were 10 million less hours worked for the month
Were they migrants who stepped off the boat /plane and straight into a Job?
If you go back to the very first post back in 2016 made by Arty (RIP) in this thread, there are some interesting comparisons.

1649903507102.png
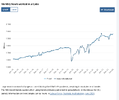
In six years since the above was posted, unemployment has gone down from 5.8% to 4%, the participation rate has gone up by 1.5%, the number of employed people has gone up by 1.5 million or around 12% , but the number of hours worked has only gone up by about 10%.
So the average worker is working 10% less hours than they did 6 years ago. Can we blame it all on COVID???
Mick

I wonder whether people are in a more relaxed frame of mind about work and income. Are some people working just enough hours to cover their expenses?

Starting to hear from local businesses about having difficulty getting staff, and having to operate with lower than normal hands on deck. Though I've had people looking for work approach me.

Yes, can we blame COVID?
 
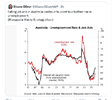
Leith Van Olsen, writing in Macrobusiness, has put the torch to the increase in employment in Australia,
The Albanese Government is hailing the “strongest start for jobs growth for any new Australian government in history”.

Treasury analysis has revealed that 333,000 more Australians were employed in April 2023 than in May 2022, which is more than three times the number of jobs gained in the first year of the Coalition government.

The same Treasury analysis reveals that 60% of jobs recorded a higher wage rise than the year before.

“More Australians in work and earning more are among the really pleasing economic outcomes over the past year”, Treasurer Jim Chalmers said.

The above sums up everything I hate about economics commentary in this nation: the persistent focus on overall growth without considering per capita outcomes.

We see it all the time with GDP, now we are seeing it with employment statistics.

Who cares that Australia has ‘created’ 333,000 jobs since May 2022 when the civilian population aged over 15 years has ballooned by 467,000 people over the same period due to record net overseas migration?

Labour supply is now growing faster than demand, meaning the ranks of Australia’s unemployed has increased for seven consecutive months:
1685699527744.png
Thus, the jobs situation – while still okay in a year-on-year context – is now turning pear shaped.

Strong jobs growth is meaningless if those jobs are now going to recent arrivals, while the number of unemployed is increasing.

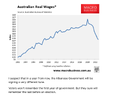
It is even worse when real wages are plummeting at the fastest rate in history:
1685699599713.png
Mick
 
My post above has been echoed somewhat in Zerohedge, but in this case, its American stats, also with most of the new jobs going to immigrants.
We live in a strange time, one where the formerly unthinkable - skepticism among the "very serious people" about government data veracity - has become mundane. And yet even though numerous bank analysts and strategists, and this site of course, have repeatedly raised questions and concerns about the credibility of the most important US economic data - the monthly jobs report - nothing ever changes and if it does, it comes in the form of periodic "seasonal adjustment" resets where we "learn" that all the data that guided markets and central banks, had been fake, manipulated wrong for years.

But even if one ignores the blatant manipulation of economic data by self-serving administrations, who hope to generate political brownie points by casting the economy in a far stronger light than is merited in reality, there are still various bizarre offshoots within the data which few notice yet which are instrumental to maintaining the fake narrative.

Such as this: readers are probably aware that according to the BLS, there are now roughly 3.3 million more jobs (155.7 million) than there were at the peak just before the covid crash (152.4 million).
1685701261679.png

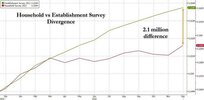
Or that according to the household survey there was virtually no new jobs created for much of 2022 even as the establishment survey indicated that over 2 million new jobs had been added over the same period.

difference%20jan%2023_0.jpg

To be sure, it didn't take long after we pointed out these glaring narrative "glitches" and discrepancies for the BLS to notice and to make the appropriate adjustments and historical revisions to the data to make it coherent. After all, bureaucrats are not very diligent and attention oriented, and manipulating bureaucrats are even worse.

Yet one place where the BLS has allowed a glaring data deficiency to persist, is in what will soon be a very politically charged and sensitive data series: where have all the new workers come from.

As noted above, if one believes the BLS, US payrolls are now a record high 155.7 million, or 161 million employed workers according to the Household survey. But if one digs a little deeper, one finds something rather peculiar: all of the jobs created since the covid crash have gone to foreign-born workers!

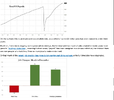
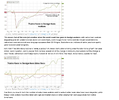
That's right: as shown in the chart below, there are currently 131.1 million native-born US workers, which is down more than half a million from the pre-covid peak of 131.7 million reached in October 2019 (data source: Federal Reserve). Meanwhile, if only looks at the number of foreign-born workers, here the data paints a very different picture: having peaked at 27.8 million in Feb 2019, the number of foreign-born workers has not only recovered its covid crash losses, but has increased by an additional 2.2 million to a record 30.0 million as of April 2023!

1685701486343.png
It is an interesting comparison, whether its justified might be debated, but the data does support the premise.
As they say, what happens in America, precedes it happening in OZ by six months.
In this case it was almost simultaneous.
Mick
 
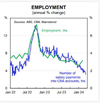
The ABS data being a survey of a subset of the population, will be inherently volatile, and my not reflect the reality in the world where people actually work.
The realworld data below suggests that there has other times when there is a sharp divergence between employment growth and the number of EFT for wages, but its usally a timing thing.
perhaps there are fewer workers using CBA bank to receive their money.
Mick

1711519779592.png
 
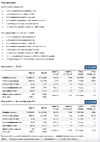
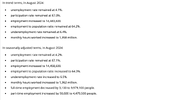
The latest unemployment/employment figures from the ABS are out.
The good bits are that employment in full time went up by 43K seasonally adjusted.
Unfortunately, hey don't put up the unadjusted figure, but given the unadjusted total figure is given as 42,300, we can assume that its somewhere around 36k after taking out the part time jobs.
Still pretty good.
Unemployment rate stayed the same in real data, but increased to 4.1% in seasonally adjusted terms.
1721273854496.png
The state by state figures show that Tasmania and WA both went backwards.
Victoria and NSW barely into positive territory.
The big winner was ACT with a 0.7% growth.
No recession in the Public Service Capital.
Queensland grew at 0.4 and SA at 0.3 respectively.
Mick
1721274322022.png
 
The latest unemployment/employment figures from the ABS are out.
The good bits are that employment in full time went up by 43K seasonally adjusted.
Unfortunately, hey don't put up the unadjusted figure, but given the unadjusted total figure is given as 42,300, we can assume that its somewhere around 36k after taking out the part time jobs.
Still pretty good.
Unemployment rate stayed the same in real data, but increased to 4.1% in seasonally adjusted terms.
View attachment 181002
The state by state figures show that Tasmania and WA both went backwards.
Victoria and NSW barely into positive territory.
The big winner was ACT with a 0.7% growth.
No recession in the Public Service Capital.
Queensland grew at 0.4 and SA at 0.3 respectively.
Mick
View attachment 181004

I'd like to see total hours paid work.

My niece is a 2nd year hairdresser apprentice, in the past two months she has been leaving for work later and coming home earlier. No more overtime, because customer visits are down, and regulars are going for cheaper options which take less time.

I am also hearing that from some other industries
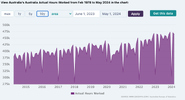
Monthly hours worked increased by 6 million. If one assumes that the extra 43k workers each worked 160 hours in a month, it comes to around 7 million hours. That does not include any hours taken up by the part time employees.
So yes, it would seem that hours worked per person has indeed gone down marginally.
Historically, hours worked per person has trended up for many years, with big falls corresponding to the January summer holiday break.
Just starting to tail off.
Mick

1721275446327.png
1721275912309.png
 
I'd like to see total hours paid work.

My niece is a 2nd year hairdresser apprentice, in the past two months she has been leaving for work later and coming home earlier. No more overtime, because customer visits are down, and regulars are going for cheaper options which take less time.

I am also hearing that from some other industries
yes that would be interesting , to me also

i suspect you are correct in this trend ( in some industries )
 
The latest unemployment/employment figures from the ABS are out.
The good bits are that employment in full time went up by 43K seasonally adjusted.
Unfortunately, hey don't put up the unadjusted figure, but given the unadjusted total figure is given as 42,300, we can assume that its somewhere around 36k after taking out the part time jobs.
Still pretty good.
Unemployment rate stayed the same in real data, but increased to 4.1% in seasonally adjusted terms.
View attachment 181002
The state by state figures show that Tasmania and WA both went backwards.
Victoria and NSW barely into positive territory.
The big winner was ACT with a 0.7% growth.
No recession in the Public Service Capital.
Queensland grew at 0.4 and SA at 0.3 respectively.
Mick
View attachment 181004
Are we following the US trend where the only new jobs are gov jobs, which however useful nurse, cops etc are nevertheless sucking blood from the economy, not adding..at least not in short or medium term.
Not that good when looking past the headline
 
Are we following the US trend where the only new jobs are gov jobs, which however useful nurse, cops etc are nevertheless sucking blood from the economy, not adding..at least not in short or medium term.
Not that good when looking past the headline
One of the problems is that so many of the government jobs are not what we might call coalface jobs.
The doctors, nurses, police, physios etc require a lot of training,
People in Admin require less.
So that is where the growth is.
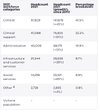
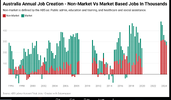
This data plate from Victorian Government Health shows that in the ten years from 2011 to 2021, Administrative roles grew by 51% , clinical grew by 45% , and clinical support grew by 61%. I asked my occupational Therapist daughter who works in a large hospital what constitues a Clinical support worker. Her answer was was anyone without a specialist degree in a field that the hospital can get to do work that a specialist degreed person might otherwise do, but at a far cheaper rate. But then she is a cynic like me.
Mick
1721347636045.png
 
Latest employment stats from ABS out.
note that once again, the number of full time jobs declined, this time by 3k, but the number of part time jobs increased by 50k.
Part time jobs now account for 30% of all jobs.
Full list of charts Here.

1726719668496.png
 
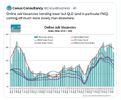
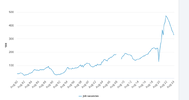
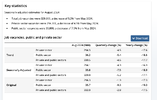
Job Vacancies in Oz continue their downward trend.
The ABS Job Vacancies report out today shows that job vacancies have fallen for the last nine consecutive quarters.
However, the vacancies are still well above the pre covid levels.
The trend however is quite clear.
I wonder when this trend will be sufficient to allow teh RBA to say the employment pressure has eased sufficiently to drop rates?
Mick

1727318941968.png

1727318719410.png
 
Job Vacancies in Oz continue their downward trend.
The ABS Job Vacancies report out today shows that job vacancies have fallen for the last nine consecutive quarters.
However, the vacancies are still well above the pre covid levels.
The trend however is quite clear.
I wonder when this trend will be sufficient to allow teh RBA to say the employment pressure has eased sufficiently to drop rates?
Mick

View attachment 184871

View attachment 184870
IMO , the RBA needs at least 5% to give it wiggle room and options ready for the big event ( aka 'soft landing ' )
 
Top