Australian (ASX) Stock Market Forum

A newbie's first question...

Joined
3 October 2023
Posts
4
Reactions
6
Hi all, I am a novice investor and new to this site.

Can anyone please tell me where I can find the end of day figures for industrial stocks and (separately) mining and oil stocks ONLINE, in a similar format to the details printed in the financial pages of the daily newspapers, and in a format (such as Excel) which allows me to do calculations on the figures.

I only require the information weekly initially, and I am prepared to pay a reasonable fee if the data is not available for free.

Thanks in advance, Harvey1
 
welcome to ASF

try here first ,

i find the data unsatisfactory for my calculations but maybe you will have a better outcome

i am not sure what is available as paid service

but my data sources dried up about May this year

dig around Yahoo Finance ( you might need the Australian version )

other members may have better solutions

cheers
 
Hi all, I am a novice investor and new to this site.

Can anyone please tell me where I can find the end of day figures for industrial stocks and (separately) mining and oil stocks ONLINE, in a similar format to the details printed in the financial pages of the daily newspapers, and in a format (such as Excel) which allows me to do calculations on the figures.

I only require the information weekly initially, and I am prepared to pay a reasonable fee if the data is not available for free.

Thanks in advance, Harvey1
Hi Harvey1, I'm not quite sure how many statistics you need for your calculations. My share trading is in many different markets and find each country has websites providing International information on other countries free.

If you go to http://www.ADVFN.com you will reach the UK's main website that provides information on many countries. It is very complex though in time you can find your way around allowing for the fact it is not set up allowing for Australia's Market Depth. It requires a free membership to access many parts.
It is useless for postings on individual shares in Australia as you will find there is virtually no interest. However, that is the case in all countries.

Stay with ASF as it is a friendly place to post information and exchange opinions. ADVFN is a virtually unregulated place where commonsense, abuse, and madness reign all together. However, it provides bags of information free.

You can set up Monitors, (Headers are in place and can be set up), etc., and have only Australian shares, exchange rates, etc., etc., - Charts on the 'quote' pages for individual shares give ASX live prices free - they are also on Headers.

Anyway, I'm sure you will manage to get there eventually.

I have been trading for over 50 years so I wish you all the best for your next 50 years.

Good luck - you will need it.
Thank you so much for your detailed response. I'm sorry, but I should have specified that I am only really interested in ASX traded shares - I am too green to look at international markets. I shall, however, look at the website that you have recommended, and see how I get on.

Meanwhile, it astounds me that the information that is printed each day in the financial pages of the Australian newspapers does not appear to be available online - either free or for a nominal fee (?)

Thanks again for your help, and I'll keep trying......
welcome to ASF

try here first ,

i find the data unsatisfactory for my calculations but maybe you will have a better outcome

i am not sure what is available as paid service

but my data sources dried up about May this year

dig around Yahoo Finance ( you might need the Australian version )

other members may have better solutions

cheers
G'day divs4ever, Thanks for the info, but unfortunately the asx based info is not what I was looking for.

I also did look at Yahoo, which has some goodies for the USA market, but so far, I haven't been able to track down anything useful for the ASX listed stocks. Thanks again anyway...............
 
What data do you want specifically? I haven't looked at a newspaper for 30 years so no idea what's in there!
Hi there galumay,

The fields that I am interested in (for ASX traded shares) are:
  • Company name
  • Company ASX code
  • Last sale
  • + or –
  • Quote Buy/sell
  • Volume 100’s
  • EPS (cents)
  • 52 week high
  • 52 week low
  • Dividend yield (%)
  • P/E ratio (%)
  • NTA (if available)
A majority of the above fields would probably suffice to begin with ............

Surely this info must be available online somewhere (???)
 
open an online broker account with, say, Commsec, then set up some watchlists.

One day you may even buy something.
Thanks Dona Ferentes, I have already opened a Commsec account, and I have created some manual watchlists.

But I am looking to do some online calculations to select stocks that fit certain criteria and are therefore eligible candidates for my watchlist/purchasing decision.

Going through the daily newspaper details manually is enormously tedious, time consuming, and it leads to missed opportunities.

I am hoping to streamline the manual process by getting the computer to do calculations for me ............
Good evening Harvey1,

Check this out:

Click on top left; Markets, Countries, Australia... and have a play.

Now then, reading aforementioned, you have a Commsec Account... Nice. Hit the products tab and have a play.
Then hit the Settings Tab and then Commsec Alert Service. Subscribe accordingly. For example rcw1 gets a whole heap of data via email at about 7-8pm ish Monday to Friday inclusive. Some stuff relevant to watchlist - Lithium:

Title: LITHIUM
CODE NAME LAST +/- OPEN HIGH LOW TRADES VOL
AAJ ARUMA RES FPO 0.0 0.0 0.0 0.0 0.0 0 0
AGY ARGOSY FPO [A 18.0 -1.5 19.5 19.5 18.0 269 3300387
AKE ALLKEM FPO [A 1115.0 -56.0 1144.0 1151.0 1115.0 12153 2816513
AS2 ASKARI MET FP 17.5 -1.5 18.5 18.5 17.5 5 23110
CXO CORE EXP FPO 42.0 -1.0 41.5 42.7 41.0 2151 31052899
EG1 EVERGREEN FPO 28.0 0.0 28.0 28.0 28.0 3 2126
GL1 GLOBALLITH FP 136.5 -3.5 140.0 141.5 135.0 368 250105
INF INF LITHI FPO 8.5 0.1 8.5 8.5 8.5 6 100000
LKE LAKE RES FPO 17.5 -0.5 18.0 18.0 17.0 186 2932007
LRS LATRES FPO [L 27.0 -1.5 28.0 29.5 25.7 1637 20069406
LTR LIONTOWN FPO 295.0 -1.0 294.0 297.0 294.0 4011 63859133
PLS PILBARAMIN FP 409.0 -12.0 410.0 415.5 407.0 13046 23492216
PMT PATRIOTBAT CD 119.0 -3.0 119.0 121.5 118.5 159 565163
SYA SAYONA FPO [S 9.5 -1.0 10.5 10.5 9.4 2981 84434664

Hope this help.
All the very best and be careful, steady freddy bloke.

Kind regards
rcw1
 
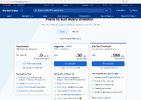
You might find Market Index website could help you out a little.
* Go to Market Index webpage.
* Click onto Plans & Portfolios TAB
*Sign up for Free Account or Choose Supporter $30 Year with 10 Watchlists with 200 stocks in each one.
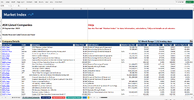
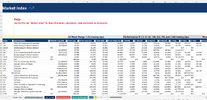
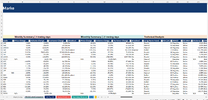
Excel spreadsheets sent to your inbox each weekend with some of the info your looking for, see below for some screen shots.

Hope it might help.

Screenshot 2023-10-03 220816.png

Screenshot 2023-10-03 221016.png


Screenshot 2023-10-03 221351.png

Screenshot 2023-10-03 221523.png
 
Hi all, I am a novice investor and new to this site.

Can anyone please tell me where I can find the end of day figures for industrial stocks and (separately) mining and oil stocks ONLINE, in a similar format to the details printed in the financial pages of the daily newspapers, and in a format (such as Excel) which allows me to do calculations on the figures.

I only require the information weekly initially, and I am prepared to pay a reasonable fee if the data is not available for free.

Thanks in advance, Harvey1,

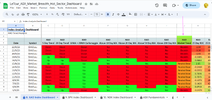
@Harvey1, welcome to our community. Have a look here, it just might be what you are after. Download this Google Sheet so that you can edit the sheet and use to position size accordingly.

Comments/Suggestions here:


Details - Market Breadth Sheets
The Market Breadth Sheets show the 'pulse' of the index via a variety of different moving averages and new highs/lows analysis. Uses colour-coded cells to visualise Market Breadth i.e. Green equals 'Bullish' Market Breadth, while Red equals 'Bearish' Market Breadth.

Current Market Breadth Sheets include: XAO (All Ords), XTO (ASX100), XSO (Small Ords)

# Additional tabbed worksheets at the bottom of the workbook.

Hot Sector/Industry Sheets
Can be used to identify Sector/Industry strength in the ASX
Identifies the 'Outperforming' stocks in the 'Outperforming' Sectors/Industries
Sorted by Hot Sector and Hot Stocks within each Sector/Industry
Shows the 'Hot' momentum sectors via Rate of Change (ROC) e.g. 10 Day ROC look back period.
A stock will only be included in the list if it's ROC value is GREATER then the Sector/Industry ROC value it resides in
E.g. if the 10 day ROC value for the Banking sector is currently 3, then only those Banking stocks with a higher ROC value of 3 will be listed

Only Sectors/Industries with positive ROC will be shown
Uses a liquidity filter...e.g. minimum close price of 0.05 and minimum daily turnover of $250,000, these filters help with weeding out some of the 'junk' / penny dreadful stocks

Currently, there are 4 Hot Sector/Industry sheets, a 10 Day (uses a 10 day look back period) and a 60 Day (uses a 60 day look back period).

The 10 Day Sheet contains the last 5 days of historical Hot Sector/Industry output. Filter your view by date/day accordingly
The 60 Day sheet will be updated sparodically as changes to the sheet will be minimal day to day, as it uses a longer lookback timeframe.

The sheets also contain some Fundamental data e.g. Market Cap, Shares on Issue & Available Cash....(Some of the data is delayed/unreliable so caution required)

ASX Near 52 Week High Sheet
Identifies Stocks that are currently trading within 10% of their 52 week high
Sorted by 1month/3month momentum
The sheets also contain some Fundamental data e.g. Market Cap, Shares on Issue & Available Cash....(Some of the data is delayed/unreliable so caution required)

ASX Near 52 Week RSI Strength
Identifies Stocks that are currently trading within 15% of their 52 week HIGH RSI Value
Sorted by 1month/3month momentum
The sheets also contain some Fundamental data e.g. Market Cap, Shares on Issue & Available Cash....(Some of the data is delayed/unreliable so caution required)

ASX Sector Breadth Sheet
Sector Breadth Analysis for: Energy, Materials, Industrials, Consumer Discretionary, Consumer Staples, Health Care, Financial, Information Technology, Communication Services, Utilities, Real Estate
Provides 60 Day / 10Day / 1Day Sector % Return
Provides 5 Day / 20 Day New High/Low analysis for each Sector

Index Dashboard
Provides Index trend/directional analysis using a variety of shorter/longer term indicators. I.e. can be used as a Regime Filter tool

Includes:

XAO - All Ords
SPX - S&P500
NDX - Nasdaq 100

The 'Market Trend' (Column 'I') tries to identify the 'flow' of the market from: Bull <-> Neutral Bull <-> Neutral Bear <-> Bear

ASX Fundamental Dashboard
Fundamental Details for ASX Stocks
Based on Delayed Quarterly Data
Can provide insights to a company's Available Cash as at their last quarterly report

Risk / Position Sizing
Download this Google Sheet so that you can edit the sheet and use to position size accordingly

Comments/Suggestions here:
LeTour Trader (@LeTourTrader) / Twitter

LeTour.png

Skate.
 
Last edited:
Top