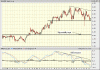
I could not find a thread on ASB so started up a new one here. I will kick it off from a technical perspective and unfortunately the picture looks a little dismal. Todays sharp fall through crucial support, will in my opinion be the continuation of bigger declines. I have marked $2.06 as a high probablity target, coinciding with the pattern (descending triangle) and previous support/resistance in '05 and '06.
A really interesting thing about this chart however, is the huge amount of negative divergence between the MACD and price, indicating that declines were inevitable. This is one of the most obvious divergences I have ever seen on a weekly chart. Great time to go short for a medium term trade in my opinion.
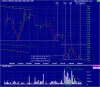
(For some reason, the chart will not update, however today's close was at $2.72) on a big red candle. Apologies")
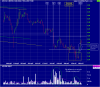
A really interesting thing about this chart however, is the huge amount of negative divergence between the MACD and price, indicating that declines were inevitable. This is one of the most obvious divergences I have ever seen on a weekly chart. Great time to go short for a medium term trade in my opinion.
(For some reason, the chart will not update, however today's close was at $2.72) on a big red candle. Apologies