Can any of the experienced traders out there please validate the usefulness of this http://www.chartgame.com in learning charts and responding to them. Eg does a good return here have any resemblance at all to the real world?
Chart game
- Thread starter merlinnn
- Start date
-
- Tags
- chart game
tech/a
No Ordinary Duck
- Joined
- 14 October 2004
- Posts
- 20,454
- Reactions
- 6,520
Can any of the experienced traders out there please validate the usefulness of this http://www.chartgame.com in learning charts and responding to them. Eg does a good return here have any resemblance at all to the real world?
Bit of fun
I only used the volume all the other rubbish is useless.
after 20 min
Attachments
So_Cynical
The Contrarian Averager
- Joined
- 31 August 2007
- Posts
- 7,467
- Reactions
- 1,469
wayneL
VIVA LA LIBERTAD, CARAJO!
- Joined
- 9 July 2004
- Posts
- 26,092
- Reactions
- 13,540
Bit of fun
I only used the volume all the other rubbish is useless.
after 20 min
Boy did I get some crappy charts, still did alright.
Attachments
Bronte
Trading The SPI for 20+ years
- Joined
- 30 July 2005
- Posts
- 1,525
- Reactions
- 1
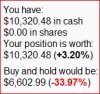
You have:
$102,008.62 in cash
$0.00 in shares
Your position is worth:
$102,008.62 (+0.00%)
Buy and hold would be:
$61,813.90 (+0.00%)
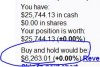
Great game")
Having trouble attaching my image.
I have sent a link to Joe's email address.
Goals of the Game: (from Chartgame Help)
It's hard to beat buy and hold (we all have here)
The original goal was to have the user beat buy and hold for the whole period played. However, playing the game, it turned out to be nearly impossible to beat buy and hold based on that criteria.
This because stocks, on average, go up a little over time. In real life, if you always have money in the market, chances are you will do better than having money in only occasionally. But if one does actively play the market, one can use the money while it's not invested in one stock to play other stocks. So I now evaluate the player based on gains achieved over the days that the money was actually invested in a stock, which gives the user benefit for actually having the money available to play other stocks with.
With the more favourable method of calculating gains only over days invested, doing completely random trades over the long term should cause you to perform roughly equivalent to buy and hold. Interestingly enough, on playing long enough, most player's performance ends up being very close to buy and hold.
$102,008.62 in cash
$0.00 in shares
Your position is worth:
$102,008.62 (+0.00%)
Buy and hold would be:
$61,813.90 (+0.00%)
Great game
Having trouble attaching my image.
I have sent a link to Joe's email address.
Goals of the Game: (from Chartgame Help)
It's hard to beat buy and hold (we all have here)
The original goal was to have the user beat buy and hold for the whole period played. However, playing the game, it turned out to be nearly impossible to beat buy and hold based on that criteria.
This because stocks, on average, go up a little over time. In real life, if you always have money in the market, chances are you will do better than having money in only occasionally. But if one does actively play the market, one can use the money while it's not invested in one stock to play other stocks. So I now evaluate the player based on gains achieved over the days that the money was actually invested in a stock, which gives the user benefit for actually having the money available to play other stocks with.
With the more favourable method of calculating gains only over days invested, doing completely random trades over the long term should cause you to perform roughly equivalent to buy and hold. Interestingly enough, on playing long enough, most player's performance ends up being very close to buy and hold.
wayneL
VIVA LA LIBERTAD, CARAJO!
- Joined
- 9 July 2004
- Posts
- 26,092
- Reactions
- 13,540
Because I have nothing better to do:
You have:
$104,984,679,328,769,586,792,384,577,564,265,684,569,824,456,847,658,762,008.62 in cash
$0.00 in shares
Your position is worth:
$104,984,679,328,769,586,792,384,577,564,265,684,569,824,456,847,658,762,008.62 (+0.00%)
Buy and hold would be:
$0.01 (+0.00%)
All done with my nnaG system.... send money.
skc
Goldmember
- Joined
- 12 August 2008
- Posts
- 8,277
- Reactions
- 329
I like this game.
It covers the last 10yrs so you don't know if you are in a bull market or the GFC.
The slight imperfection is that you are always trading at the openning price of the next day, but that's fair enough for an EOD trader.
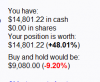
Here's what I did after 1 chart... if only life was so easy
It covers the last 10yrs so you don't know if you are in a bull market or the GFC.
The slight imperfection is that you are always trading at the openning price of the next day, but that's fair enough for an EOD trader.
Here's what I did after 1 chart... if only life was so easy
Attachments
Sean K
Moderator
- Joined
- 21 April 2006
- Posts
- 22,603
- Reactions
- 12,162
:batman:Because I have nothing better to do:
You have:
$104,984,679,328,769,586,792,384,577,564,265,684,569,824,456,847,658,762,008.62 in cash
$0.00 in shares
Your position is worth:
$104,984,679,328,769,586,792,384,577,564,265,684,569,824,456,847,658,762,008.62 (+0.00%)
Buy and hold would be:
$0.01 (+0.00%)
All done with my nnaG system.... send money.
Bronte
Trading The SPI for 20+ years
- Joined
- 30 July 2005
- Posts
- 1,525
- Reactions
- 1
12 charts / companies
28 Trades (didn't take long at all)
+ 920.1 %
+ 88.44% Annually
It's just a game
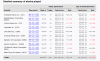
From the Chartgame link: (sent to Joe Blow)
AutoZone Inc. (AZO) Jul 22, 1998
Oct 09, 1998 52/56 2 $10,000.00
$13,640.93 +36.41% $10,000.00
$6,010.59 -39.89%
Monster Worldwide, Inc. (MWW) Apr 17, 2003
Jun 20, 2003 40/44 2 $13,640.93
$21,311.22 +56.23% $6,010.59
$9,856.03 +63.98%
Analog Devices Inc. (ADI) Sep 22, 1998
Nov 27, 1998 44/47 2 $21,311.22
$28,773.43 +35.02% $9,856.03
$13,307.16 +35.02%
McCormick & Co. Inc. (MKC) May 24, 2000
Dec 29, 2000 55/152 4 $28,773.43
$30,509.95 +6.04% $13,307.16
$15,001.01 +12.73%
Campbell Soup Co. (CPB) May 13, 2005
Sep 30, 2005 53/97 4 $30,509.95
$31,492.35 +3.22% $15,001.01
$14,762.03 -1.59%
EMC Corporation (EMC) May 14, 2003
May 12, 2004 251/251 2 $31,492.35
$33,765.95 +7.22% $14,762.03
$15,827.78 +7.22%
Caterpillar Inc. (CAT) Nov 03, 2008
Aug 21, 2009 197/201 2 $33,765.95
$40,019.87 +18.52% $15,827.78
$19,281.19 +21.82%
Comerica Incorporated (CMA) Mar 14, 2000
Jun 08, 2000 55/59 4 $40,019.86
$62,679.13 +56.62% $19,281.19
$29,050.09 +50.67%
Dover Corp. (DOV) Jul 16, 2003
Oct 31, 2003 72/76 2 $62,679.13
$75,838.82 +21.00% $29,050.09
$35,582.98 +22.49%
Sprint Nextel Corp. (S) Jul 01, 2002
Dec 20, 2002 0/121 0 $75,838.82
$75,838.82 +0.00% $35,582.98
$50,493.94 +41.90%
Molex Inc. (MOLX) Dec 20, 2007
May 09, 2008 92/96 2 $75,838.82
$81,902.57 +8.00% $50,493.94
$53,675.39 +6.30%
Advanced Micro Devices Inc. (AMD) Mar 11, 2003
Mar 28, 2003 9/13 2 $81,902.57
$102,008.62 +24.55% $53,675.39
$61,813.90 +15.16%
Totals: 920/1213 28 $102,008.62 +920.1% $61,813.90 +518.1%
Security Time period Days in Trades Cash in/out Gain Cash in/out Gain
Total % gain +920.1% +518.1%
Total days invested 920 1213
Total number of trades 28 24
Equivalent daily gain* +0.253% +0.150%
Annualized gain for days invested** +88.44% +45.78%
28 Trades (didn't take long at all)
+ 920.1 %
+ 88.44% Annually
It's just a game
From the Chartgame link: (sent to Joe Blow)
AutoZone Inc. (AZO) Jul 22, 1998
Oct 09, 1998 52/56 2 $10,000.00
$13,640.93 +36.41% $10,000.00
$6,010.59 -39.89%
Monster Worldwide, Inc. (MWW) Apr 17, 2003
Jun 20, 2003 40/44 2 $13,640.93
$21,311.22 +56.23% $6,010.59
$9,856.03 +63.98%
Analog Devices Inc. (ADI) Sep 22, 1998
Nov 27, 1998 44/47 2 $21,311.22
$28,773.43 +35.02% $9,856.03
$13,307.16 +35.02%
McCormick & Co. Inc. (MKC) May 24, 2000
Dec 29, 2000 55/152 4 $28,773.43
$30,509.95 +6.04% $13,307.16
$15,001.01 +12.73%
Campbell Soup Co. (CPB) May 13, 2005
Sep 30, 2005 53/97 4 $30,509.95
$31,492.35 +3.22% $15,001.01
$14,762.03 -1.59%
EMC Corporation (EMC) May 14, 2003
May 12, 2004 251/251 2 $31,492.35
$33,765.95 +7.22% $14,762.03
$15,827.78 +7.22%
Caterpillar Inc. (CAT) Nov 03, 2008
Aug 21, 2009 197/201 2 $33,765.95
$40,019.87 +18.52% $15,827.78
$19,281.19 +21.82%
Comerica Incorporated (CMA) Mar 14, 2000
Jun 08, 2000 55/59 4 $40,019.86
$62,679.13 +56.62% $19,281.19
$29,050.09 +50.67%
Dover Corp. (DOV) Jul 16, 2003
Oct 31, 2003 72/76 2 $62,679.13
$75,838.82 +21.00% $29,050.09
$35,582.98 +22.49%
Sprint Nextel Corp. (S) Jul 01, 2002
Dec 20, 2002 0/121 0 $75,838.82
$75,838.82 +0.00% $35,582.98
$50,493.94 +41.90%
Molex Inc. (MOLX) Dec 20, 2007
May 09, 2008 92/96 2 $75,838.82
$81,902.57 +8.00% $50,493.94
$53,675.39 +6.30%
Advanced Micro Devices Inc. (AMD) Mar 11, 2003
Mar 28, 2003 9/13 2 $81,902.57
$102,008.62 +24.55% $53,675.39
$61,813.90 +15.16%
Totals: 920/1213 28 $102,008.62 +920.1% $61,813.90 +518.1%
Security Time period Days in Trades Cash in/out Gain Cash in/out Gain
Total % gain +920.1% +518.1%
Total days invested 920 1213
Total number of trades 28 24
Equivalent daily gain* +0.253% +0.150%
Annualized gain for days invested** +88.44% +45.78%
tech/a
No Ordinary Duck
- Joined
- 14 October 2004
- Posts
- 20,454
- Reactions
- 6,520
Truly remarkable Bronte.
Bronte
Trading The SPI for 20+ years
- Joined
- 30 July 2005
- Posts
- 1,525
- Reactions
- 1
You to are doing some great work on the breakout threads.
Potential & Breakout trading--Technical tips and tricks:
https://www.aussiestockforums.com/forums/showthread.php?p=591053#post591053
Thank you tech/a
Potential & Breakout trading--Technical tips and tricks:
https://www.aussiestockforums.com/forums/showthread.php?p=591053#post591053
Thank you tech/a
wayneL
VIVA LA LIBERTAD, CARAJO!
- Joined
- 9 July 2004
- Posts
- 26,092
- Reactions
- 13,540
You to are doing some great work on the breakout threads.
Potential & Breakout trading--Technical tips and tricks:
https://www.aussiestockforums.com/forums/showthread.php?p=591053#post591053
Thank you tech/a
Tech/a
Ever feel like someone is p1ssing in your pocket?
Bronte
Trading The SPI for 20+ years
- Joined
- 30 July 2005
- Posts
- 1,525
- Reactions
- 1
No we mean what we posted.You to are doing some great work on the breakout threads.
Potential & Breakout trading--Technical tips and tricks:
https://www.aussiestockforums.com/forums/showthread.php?p=591053#post591053
Thank you tech/a
Excellent info for members:
Truly BRM took off
tech/a
No Ordinary Duck
- Joined
- 14 October 2004
- Posts
- 20,454
- Reactions
- 6,520
Tech/a
Ever feel like someone is p1ssing in your pocket?
Regularly.
Tech/a
Ever feel like someone is p1ssing in your pocket?
That's a cynical enough comment Wayne L, I reckon Bronte meant well..'
It's easy enough posting results , and getting a good looking result if you do this exercise often enough, how about ASF run an EOD simulation
with the same characters involved, and see how the results pan out...??? say over a three month period or something similar ??
Funny that no one posted a negative result v buy and hold...must be all geniuses here...
wayneL
VIVA LA LIBERTAD, CARAJO!
- Joined
- 9 July 2004
- Posts
- 26,092
- Reactions
- 13,540
That's a cynical enough comment Wayne L, I reckon Bronte meant well..'
I've known the Bronteman longer than you.
wayneL
VIVA LA LIBERTAD, CARAJO!
- Joined
- 9 July 2004
- Posts
- 26,092
- Reactions
- 13,540
Excellent info for members:
Indeed.
Just a peculiar time to mention it.
I've known the Bronteman longer than you.
An inside joke I'm guessing ??
tech/a
No Ordinary Duck
- Joined
- 14 October 2004
- Posts
- 20,454
- Reactions
- 6,520
- Joined
- 7 December 2006
- Posts
- 254
- Reactions
- 0
Cool thanks for posting. Had a few goes before I got the hang of it. This was probably after an hour or so... Some charts I just did really badly on, so cut my losses and skipped to the next but overall not a bad result!
Tony.
edit: actually now I look at the overall results it was bad! all the gains in the first stock and then up and down for the rest of the time basically staying the same overall... more practice me thinks, the first was probably more ass than class.
Tony.
edit: actually now I look at the overall results it was bad! all the gains in the first stock and then up and down for the rest of the time basically staying the same overall... more practice me thinks, the first was probably more ass than class.
Attachments
Similar threads
- Replies
- 40
- Views
- 4K
- Replies
- 34
- Views
- 2K