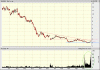
Just practising my chart skills. How does this look for using a support/resistance line and BBand?
From the chart:
It looks like the SP has bounced off the support line 3 times indicating that it looks to be a strong support line.
A triangle is forming... I'm not too sure about this one though - a little wide on both ends.
Bollinger Band - widens on the bottom where there is an up trend and widens on the top where there is a down trend. Gets tight when in a sideways trend. Left the setting as it appeared. Don't know what settings to change to (for short term).
How did I go?!
 :
: