Australian (ASX) Stock Market Forum

US Unemployment

Joined
17 November 2010
Posts
4
Reactions
1
Currently, over the past 12 months, 20% of the American working population have filed a claim for unemployment benefits. That is 24.5 million claims over a 52 week period, with the working population stated as 125.8 million people.

One problem with the US is that the working population is declining as the total population is increasing.

The population of the US is about 310 million people, and only 126 million are in the workforce. And of the workforce, the official unemployment rate is 9.6%, ranging up to 16.7% depending on your definitions.

So from the peak in 2001, 4.5 % (or 13.8 million) of the population have left the workforce and are not looking for work. Add in 12 million to 21 million unemployed (depending on definitions) then you realize that a serious amount of income has been withdrawn from the economy.

Too often we get caught up in the sound bits about unemployment statistics, when any business/household knows it is really about the cashflow you can generate and how many mouths you have to feed.
 
Fridays US employment stats contained some interesting dot point.
From The Hill
Firstly, at a growth of 678k new jobs, it beath the experts employment consensus targets by 275k.
Secondly, the "nominal" unemployment rate dropped to 3.8%.
Thirdly, the number of hours worked per employee jumped by 5.1% over the past 12 months.
Fourthly, the BLS revised upwards both the December and January increases in employment by 92,000 jobs.
All this is a good for the US economy.
The bad news
The number of Americans who said they could not look for a job because of the pandemic — who are not counted as unemployed — fell from 1.8 million in January to 1.2 million last month. The number of people who lost hours at work because of a pandemic-related shutdown also sunk from 6 million in January to 4.2 million in February.
The sort of jobs created though, are not really high powered value adding highly skilled employees.
Leisure and hospitality employment rose by 179,000 jobs in February, led by a gain of 124,000 jobs in restaurants and bars. Professional and business services added 95,000 jobs, the health care sector added 64,000 jobs and construction employment rose by 60,000 after staying flat in January.

Transportation and warehousing employment rose by 48,000 in February, and retail trade employment rose by 37,000.
Still, its probably enough for the Fed to have another 25bps rise next meeting.
Mick
 
The employment figures coming out of the US last Friday were greeted with varying degrees of enthusiasm, so Rueters, SMH and and the Fin review all thought it bolstered the case for another rate rise.
CNN, NYtimes were less sanguine, while Business Insider, Zero hedge among others were quite negative.
Its one of those glass half full scenarios.
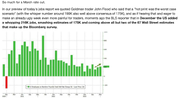
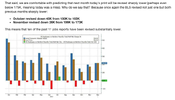
Zero hedge saw the numbers not only fall well below consensus expectation (do they ever get the expectation right?), but the more telling figures were that the blowout figures for May were revised down from 339k to 306 k, and the April figures revised down from 279k to 214 k.
It means now that every single month of 2023 has seen a downward revision of previous periods employment figures, with every expectation that June's figures are likely to be downgraded in coming months.
1688895113990.png
the good news is that weekly earnings per hour have gone up slightly again, gieving a rolling averagr of 4% increase for the previous 12 months.
Mick
 
The employment figures coming out of the US last Friday were greeted with varying degrees of enthusiasm, so Rueters, SMH and and the Fin review all thought it bolstered the case for another rate rise.
CNN, NYtimes were less sanguine, while Business Insider, Zero hedge among others were quite negative.
Its one of those glass half full scenarios.
Zero hedge saw the numbers not only fall well below consensus expectation (do they ever get the expectation right?), but the more telling figures were that the blowout figures for May were revised down from 339k to 306 k, and the April figures revised down from 279k to 214 k.
It means now that every single month of 2023 has seen a downward revision of previous periods employment figures, with every expectation that June's figures are likely to be downgraded in coming months.
View attachment 159322
the good news is that weekly earnings per hour have gone up slightly again, gieving a rolling averagr of 4% increase for the previous 12 months.
Mick
And right on cue, the BLS has admitted that employment growth is at least 300,000 less than last year figures.
From Zero hedge
US job growth was far less robust in the year through March than previously reported, and according to the BLS the number of workers on payrolls will be revised down by at least 306,000, and likely much more when the final revisions take place in early 2024.
The revision results from a comparison between reported nonfarm payrolls and a (near) universe count of employment from unemployment insurance records. In last year’s benchmark revision, the BLS revised up nonfarm payrolls by 506k.

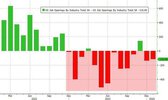
The BLS table below shows the March 2023 preliminary benchmark revisions by major industry sector. While the preliminary benchmark revisions are calculated only for the month of March 2023 for major industry sectors, the data for all CES series will be updated when the final benchmark revision is issued.
The background, for those who missed it: once a year, the BLS benchmarks the March payrolls level to a more accurate but less timely data source called the Quarterly Census of Employment and Wages (QCEW) that’s based on state unemployment insurance tax records and covers nearly all US jobs. When the March payrolls figures are aligned to that count, the change is proportionally distributed across the year ended in March. First-quarter QCEW figures were also released Wednesday.

QCEW is used as the benchmark because it is a more comprehensive count of jobs than NFP. It aims at a complete count of all 11 million establishments/workplaces in the US and has a 90%+ response rate, compared to 660k establishments surveyed by NFP with a 43% response rate.

While the preliminary downward adjustment was smaller than some economists expected - of note, Std Chartered's Steven Englander had expected at least 650,000 jobs to be revised out - keep in mind this is only the first revision; the final revision - which is incorporated into the data series with the release of the January jobs report in February 2024 - and in keeping with the Biden admin's stealthy downward revisions, expect at least another 300K or so jobs to magically disappear from the total, which will "gradually" come down to the cumulative household survey which remains about 1 million lower than the market-moving, if extremely inaccurate and politically sensitive, establishment survey.

Mick
Edited to add source.
 
There was another fall in the US Job openings last month.
From trading economics
1693381831229.png
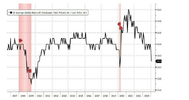
There have now been three months in sucession where the JOLTSdata has fallen, has indeed fallen in six of the last seven months.
The quits rate edged down slightly to 2.3% from 2.4% in the prior report, taking it to the lowest since January 2021. The Fed will be pleased with this result as it shows signs of a cooling labour market, which the recent minutes noted would likely be necessary to bring inflation back to target and add to the recent declines seen in JOLTS reports recently.

Mick
 
There was another fall in the US Job openings last month.
From trading economics
View attachment 161631
There have now been three months in sucession where the JOLTSdata has fallen, has indeed fallen in six of the last seven months.
The quits rate edged down slightly to 2.3% from 2.4% in the prior report, taking it to the lowest since January 2021. The Fed will be pleased with this result as it shows signs of a cooling labour market, which the recent minutes noted would likely be necessary to bring inflation back to target and add to the recent declines seen in JOLTS reports recently.

Mick
Hard landing looking likely for the USA.
 
The US BLS has released the latest unemployment stats.
On the surface, they look ok/
1695954184878.png
1695954264674.png


The problem is, not many people outside the government have much faith in the adjusted data that the BLS puts out.
1695954346869.png

Mick
 
Last night the number of job openings reported by the BLS soared to 9.61 million, meaning that according to the BLS, there are now more jon openings than unemployed people. Pretty impressive.
Unfortunately, like so much of the figures coming out of the BLS, they are at best misleading, if not a complete fraud.
Some 70% of the increase was due to the phantom jobs that the black box adjustments that are performed by the BLS.
FromZero Hedge
According to the BLS, job openings increased in professional and business services (+509,000), finance and insurance (+96,000), state and local government education (+76,000), nondurable goods manufacturing (+59,000), and federal government (+31,000). Again: it is the BLS' position that there was a 35% increase in professional and business services job openings, an absolutely hilarious goalseeking of data.
And while we have previously discussed the chronic fabrication of job openings data by the BLS, which goes against all private surveys, we are confident that when the Biden admin finally falls and some enterprising forensic accountant digs to find out just where all these bull**** numbers came from, what they will find is some political hack at the BLS/DOL claiming that it's not their fault, but rather that it's the response rate. And indeed, as the BLS itself indicates, the response rate to most of its various labor (and other) surveys has collapsed in recent years, nothing is as bad as the JOLTS report where the actual response rate has tumbled to a record low 31%
1696383094221.png
Another data point is that small buiness bankruptcies have increased to the highest levels since the 2020 covid crisis.
Nearly 1,500 small businesses filed for Subchapter V bankruptcy this year through Sept. 28, nearly as many as in all of 2022, according to the American Bankruptcy Institute.

Bankruptcy petitions are just one sign of financial stress. Small-business loan delinquencies and defaults have edged upward since June 2022 and are now above prepandemic averages, according to Equifax.

An index tracking small-business owners’ confidence ticked down slightly in September, driven by heightened concerns about the economy, according to a survey of more than 750 small businesses. Fifty-two percent of respondents believed that the country is approaching or in a recession, said the survey by Vistage Worldwide, a business-coaching and peer-advisory firm.

Robert Gonzales, a bankruptcy attorney in Nashville, said he’s now getting four times as many calls as he did a year ago from small businesses considering a bankruptcy filing.

“We are just at the front end of the impact of these dramatically higher interest rates,” Gonzales said. “There are going to be plenty of small businesses that are overleveraged.”
1696383305787.png

From Mish Talk
Just to add to that, in recent weeks, California has has increased the minimum wage for a range of hospitality workers by 30%.
This will obviously make input costs in the hospitality industry significantly higher.
So a couple of results are possibel
The industry increases wages with a subsequent increase in its menu prices which is inflationary and may reach a resistance bar where customers will not eat at a restaurant.
The business increases wages but does not increase out put prices.
The business may not increase menu prices, but cuts back on labour.
Any of these outcomes may increase bankruptcies, some more than others.
Mick
 
So last night the BLS comes out with headline grabbing blowout figures in employment.
But once again, you have to look at the underlying data to get a better picture.
Someone wrote on this site a few years ago, that they discounted Zerohedge as a source of info because they were always negative.
They certain are almost always negative, but that may be because they have a lot to be negative about.
One might question their analysis, but its hardly BS.
They sometimes decry seasonal adjustments, and at other times use them to bolster a case.
Anyway, once again they did a number on last nights results.
This is the takeaway I got
1696631379695.png

From Zero hedge

1696631145261.png

1696631291085.png1696631218245.png
Mick
 
It is surprising that the growth was highest in small business, and the jobs lost higher the business size.
not so surprising .. the small businesses were crushed during the pandemic saga , many would have laid off staff ( while others looted the payroll protection scam so they had plenty of room to grow back to normal ( even if the spirit was weak )

often there is plenty of fat in big business as divisional managers try to grew 'empires' underneath them , and bigger businesses are liable to have a bigger ( by proportion ) debt load , remember half these corporate crackers were borrowing cheap to buy back company stock

have been watching this since 2017 and just rolling my eyes and shaking my head ( and exiting the corporate debt exposure )
 
The latest unemployment stats are as usual, a bit mixed.
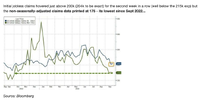
Firstly, the number of Americans filing for jobless benefits for the first time last week slipped to 217k hovering near YTD lows and showing absolutely no signs at all of any labor market stress.
However, to achive that drop in unemployment, they merely revised upwards last months first time jobless claims to 220k.
Standard BLS manipulation.
For the sixth straight week, continuing unemployment claims rose.
1699650566539.png
At some point, the seasonal adjustments ill have to turn in the opposite direction, not even the BLS can claim that seasonal factors can only go in one direction.
Mick
 
The latest unemployment stats are as usual, a bit mixed.
Firstly, the number of Americans filing for jobless benefits for the first time last week slipped to 217k hovering near YTD lows and showing absolutely no signs at all of any labor market stress.
However, to achive that drop in unemployment, they merely revised upwards last months first time jobless claims to 220k.
Standard BLS manipulation.
For the sixth straight week, continuing unemployment claims rose.
View attachment 165567
At some point, the seasonal adjustments ill have to turn in the opposite direction, not even the BLS can claim that seasonal factors can only go in one direction.
Mick
Like any Govt output rubbery figures to show the peasants "we are the saviousrs of your souls" bs.
 
The US payroll data that came out for December shows a surprising increase.
From Zero hedge
1704597900849.png
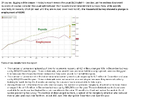
However, the zero hedge pundists take it with a grain of salt, given that they expectt that these same big payroll figures will be revised downwards, just like last months, and the ten months prior to that also were revised downward.
1704598087196.png

1704598208266.png
So many contradictory data points.
Hard to know what is the "real " picture.
Mick
Edited to add the following

1704599192260.png
 

Attachments

  • 1704599165091.png
    1704599165091.png
    28.2 KB · Views: 0
Last edited:
The US job figures came out last night, and are frankly preposterous.
The BLS has made an artform in producing figures that defy believability, and once again has produced the goods
Firstly, lat months ridiculously booming jobs increase was revised down by 30%.
Secondly, the published new jobs figures of 275k in February, but also publishing that unemployment had gone up again by 0.2% to 3.9%.
There must have been a massive increase in the participation rate (via hige immigration numbers) to accomodate these figures.
The average hourly earnings surged in last months figures, but as usual, was revised downwards from 0.6% to 0.5%., but the published growth for this month only increased by 0.1%, the lowest unadjusted figure in two years.
Whats the bet they will become negative after its adjusted next month.
To get to this measly increase, they had to make the actual hours worked plunge to levels approaching covid.
1709937788398.png
It also revised upwards the hours worked for last month , which helps to make a statistically correct increase.
The problem is, fewer and fewer people are believing them.
Back in September, Jeff Neilson pointed out an obvious fallacy in the BLS figures.
I have been one of the most outspoken critics of the monthly nonsense which the U.S. Bureau of Labor Statistics calls its “non-farm payrolls report”. Because the BLS has adopted numerous “techniques” for “adjusting” its numbers (i.e. lying), I have steered clear of their doctored numbers in previous criticisms – and focused on one of the few pieces of “hard data” available on U.S. employment: the weekly lay-off reports.

Traditionally, once those weekly lay-off reports begin to significantly exceed one million when totaled up on a monthly basis, the U.S. economy begins to experience net job-losses. Thus, when the weekly lay-offs soared to as high as 3 million per month, I pointed out that as a matter of simple arithmetic, the net job-losses had to increase to somewhere close to 2 million per month. In fact, this is likely a conservative estimate, as the weekly lay-off reports only capture a portion of the U.S. jobs market.

However, I recently begin looking at a different report – reported by the same BLS – that releases the same data, but on a state-by-state basis. I was motivated to do so after reading the unmitigated drivel in a recent article from the Financial Times which was analyzing the U.S. jobs reports. The following statement caught my eye:

Although U.S. joblessness has shown signs of easing nationally in recent months, it continues to accelerate at the state level.
In other words, the oxymoron which the Financial Times (and the rest of the propaganda-machine) is trying to pass-off is that the United States has two, entirely separate economies. There is the “national” economy - where the propaganda-machine assures us “the recession is over”, then there is the separate, state-by-state economy, where the “recession” continues to get worse.

It should therefore not be a big surprise to regular readers that the BLS's recent, state-by-state numbers have absolutely zero correlation with their aggregate reports. To use less technical language, not only do the state-by-state numbers not add up to the aggregate national numbers, there is simply no relationship between the two sets of numbers.

This complete divorce between the two sets of data has taken place over the last 3 months, which also should not be a surprise – since this is the same time period where I have accused the BLS of producing its largest lies (see “U.S. created 2 million jobs in August, claim experts).

To provide some context for this period, I will refer back to our only hard data: the weekly lay-off reports. Weekly lay-offs peaked at roughly 3 million per month, during the spring of this year.
While there has been some improvement, lay-offs are still adding up to roughly 2.5 million per month – far above the 1.2 million lay-offs per month which the U.S. was experiencing when it began losing jobs monthly on a net basis.

As I have written on many occasions, lay-offs at this level imply net monthly job-losses of at least 1.5 million jobs (see “U.S. economy to lose 20 MILLION jobs this year”).

Conversely, here are the fictional numbers from the BLS for those same, three months:

  • June 467,000 jobs lost
  • July 247,000 jobs lost
  • August 216,000 jobs lost
This brings us to the separate reports from the BLS, with which it reports payroll changes on a state-by-state basis. Sadly, data is not included for every state, however the data which is present proves that when the BLS produces its aggregate number that it is not simply a total of the jobs lost in the 50 U.S. states – in other words, its headline aggregate number is obviously a fabrication (here are the complete reports).

Here are the tables of “statistically significant” changes in employment for the last three months:

The data which is contained provides data on all states with “statistically significant” job losses, along with a tally of how many states lost jobs (or gained jobs) over the month. Here is that last piece of data, over the previous three months:

  • June 39 states down, 10 states up (1 unchanged)
  • July 29 states down, 21 states up
  • August 42 states down, 8 states up
Already, we can see a huge discrepancy in the numbers. While both sets of data, show huge, fictional improvements between June and July, the state-by-state data shows a reversal for August – with the labour market obviously deteriorating dramatically based upon their own measurements. However, this didn't stop the BLS from refuting its own data to report an improvement between July and August, when it released its aggregate number.

The disconnect between the two sets of data is even more stunning when we look at “states with statistically significant employment changes” month to month, “seasonally adjusted”. Before I discuss the data, a few comments are in order.
The article goes a lot further looking into the discrepancy between the state figures and aggregate figures, if anyone wants to look at it go for it.
These figures are somewhat out of date, but despite wasting half an hour pouring through the various tables on the latest BLS report, could not find the equivalent figures.
Maybe I need to waste another hour.
Mick
 
The US job figures came out last night, and are frankly preposterous.
The BLS has made an artform in producing figures that defy believability, and once again has produced the goods
Firstly, lat months ridiculously booming jobs increase was revised down by 30%.
Secondly, the published new jobs figures of 275k in February, but also publishing that unemployment had gone up again by 0.2% to 3.9%.
There must have been a massive increase in the participation rate (via hige immigration numbers) to accomodate these figures.
The average hourly earnings surged in last months figures, but as usual, was revised downwards from 0.6% to 0.5%., but the published growth for this month only increased by 0.1%, the lowest unadjusted figure in two years.
Whats the bet they will become negative after its adjusted next month.
To get to this measly increase, they had to make the actual hours worked plunge to levels approaching covid.
View attachment 172415
It also revised upwards the hours worked for last month , which helps to make a statistically correct increase.
The problem is, fewer and fewer people are believing them.
Back in September, Jeff Neilson pointed out an obvious fallacy in the BLS figures.

The article goes a lot further looking into the discrepancy between the state figures and aggregate figures, if anyone wants to look at it go for it.
These figures are somewhat out of date, but despite wasting half an hour pouring through the various tables on the latest BLS report, could not find the equivalent figures.
Maybe I need to waste another hour.
Mick
Yes even the data are contradictory.
Is that the way the zombie Biden is looking for reelection?
 
The latest Job opening data (JOLTS) from the US shows virtually no cgange from the previous month.
ecan%20openings%20april%2024.jpg
But as they have done for 12 of the past 14 months, the previous months data was quietly revised downwards.
jolts%20revisions%20down.jpg
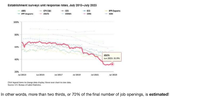
Not that it really matters, the response rate to the surveys was barely 33%, which menas that the remainder, nearly 70%, were estimated(aka completely made up of guesswork).
Believe the official stats if you want, but they are more likely to be as far apart from reality as the Greens.
Mick
 
The latest BLS data from the US beat narket estimates by a long way.
However, as usual , when looking into the data a little deeper than the headline, the standard discrepencies pop up.
From Zero Hedge
Firstly, the previous two months employment data was revised downwards.
1720215204509.png
Private sector workers came in at 160k, and the number of private sector workers for the last two months were revised downwards as well.
The rest, around 70k, were filled by government workers.
In the meantime, Unemployment continues above 4%.
1720215546457.png

Hardly an inspiring set of numbers.
Mick
 
Top