- Joined
- 2 April 2024
- Posts
- 66
- Reactions
- 95
So, NAB buy or sell?Hi all,
Hope everyone is happy and healthy. Tonight I just had a time to toy around with my smoothing method. You can call this indicator smooth McD, Stochastic momentum or whichever you like .
I can see the potential of the second smoothing method that produce less noise noise than the first one
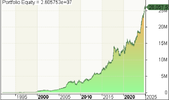
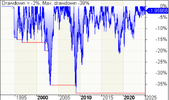
View attachment 193860
| Statistics |
|---|
| All trades | Long trades | Short trades | |
|---|---|---|---|
| Initial capital | 100000.00 | 100000.00 | 100000.00 |
| Ending capital | 26057526.58 | 26057526.58 | 100000.00 |
| Net Profit | 25957526.58 | 25957526.58 | 0.00 |
| Net Profit % | 25957.53% | 25957.53% | 0.00% |
| Exposure % | 73.71% | 73.71% | 0.00% |
| Net Risk Adjusted Return % | 35216.04% | 35216.04% | -nan(ind)% |
| Annual Return % | 18.27% | 18.27% | 0.00% |
| Risk Adjusted Return % | 24.79% | 24.79% | -nan(ind)% |
| Transaction costs | 0.00 | 0.00 | 0.00 |
| All trades | 1661 | 1661 (100.00 %) | 0 (0.00 %) |
| Avg. Profit/Loss | 15627.65 | 15627.65 | -nan(ind) |
| Avg. Profit/Loss % | 7.07% | 7.07% | -nan(ind)% |
| Avg. Bars Held | 35.95 | 35.95 | -nan(ind) |
| Winners | 858 (51.66 %) | 858 (51.66 %) | 0 (0.00 %) |
| Total Profit | 53975739.72 | 53975739.72 | 0.00 |
| Avg. Profit | 62908.79 | 62908.79 | -nan(ind) |
| Avg. Profit % | 22.58% | 22.58% | -nan(ind)% |
| Avg. Bars Held | 49.01 | 49.01 | -nan(ind) |
| Max. Consecutive | 12 | 12 | 0 |
| Largest win | 3402446.07 | 3402446.07 | 0.00 |
| # bars in largest win | 98 | 98 | 0 |
| Losers | 803 (48.34 %) | 803 (48.34 %) | 0 (0.00 %) |
| Total Loss | -28018213.13 | -28018213.13 | 0.00 |
| Avg. Loss | -34891.92 | -34891.92 | -nan(ind) |
| Avg. Loss % | -9.51% | -9.51% | -nan(ind)% |
| Avg. Bars Held | 21.99 | 21.99 | -nan(ind) |
| Max. Consecutive | 14 | 14 | 0 |
| Largest loss | -1167822.44 | -1167822.44 | 0.00 |
| # bars in largest loss | 8 | 8 | 0 |
| Max. trade drawdown | -1710825.87 | -1710825.87 | 0.00 |
| Max. trade % drawdown | -66.36 | -66.36 | 0.00 |
| Max. system drawdown | -3013443.17 | -3013443.17 | 0.00 |
| Max. system % drawdown | -39.09% | -39.09% | 0.00% |
| Recovery Factor | 8.61 | 8.61 | -nan(ind) |
| CAR/MaxDD | 0.47 | 0.47 | -nan(ind) |
| RAR/MaxDD | 0.63 | 0.63 | -nan(ind) |
| Profit Factor | 1.93 | 1.93 | nan |
| Payoff Ratio | 1.80 | 1.80 | nan |
| Standard Error | 2816678.46 | 2816678.46 | 0.00 |
| Risk-Reward Ratio | 0.21 | 0.21 | -nan(ind) |
| Ulcer Index | 9.99 | 9.99 | 0.00 |
| Ulcer Performance Index | 1.29 | 1.29 | -inf |
| Sharpe Ratio of trades | 0.59 | 0.59 | 0.00 |
| K-Ratio | 0.02 | 0.02 | -nan(ind) |


Hello and welcome to Aussie Stock Forums!
To gain full access you must register. Registration is free and takes only a few seconds to complete.
Already a member? Log in here.