Australian (ASX) Stock Market Forum

Momentum burst is a phenomenon in the markets

Joined
13 October 2021
Posts
21
Reactions
21
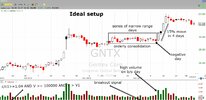
Stocks move in momentum burst of 3 to 5 days. You can use this stock's tendency to your advantage. Look for these following:
Essentially if you look for top gainers in the day (mostly focus on the ones that are up and over 4% - this is the range expansion day if you look at the candle. In this day volume must be higher than previous day.
To support this the previous day the stock should have a narrow range or even better if its a down day.
The stock can have 3-20 days of consolidation prior to this range expansion day.
On the range expansion day the stock must close near its high.
Stock should be in an uptrend (supported by being any of the simple moving averages say 10 or 20 days or even 50 days)
The stock chart should not be sideways but a linear uptrend must be noticeable.

In 3-5 days, stocks identified using the above rules can make 8 to 40% in 3 to 5 days. For higher priced stocks, typically over 40$ they move in 5 to 25$ bursts.

Try to observe this set up and if you post charts I can pass my feedback. This is one of the simple set ups I use for swing trading.
 
Hi, can you post a chart (live) and then we can see how it works. I see on the website you advertise it states that you guarantee profits. How do you verify this?

Thanks
 
I will post a chart soon explaining this phenomenon. I personally don’t guarantee your profits. What I mean is: If you apply the principles and don’t let losing trades run, you will preserve your capital and in the end make money. As long as you mechanically follow the rules you will make money.
 
There are a number of patterns and trading strategies which have some similarities to this one.
Darvas
Volume Control Bars.
Basic Breakout from consolidation
A useful pattern which a few here already use a form of now.
 
There are a number of patterns and trading strategies which have some similarities to this one.
Darvas
Volume Control Bars.
Basic Breakout from consolidation
A useful pattern which a few here already use a form of now.
Agree. True that. There are many possible variations but essentially this is an impulse move of 3 to 5 day duration. It is largely a mechanical way to trade for small profit targets. Stocks seldom run up or down smoothly.

A 30% move in stock over 3 months in a stock might be completed in 2 momentum bursts of 10 to 15% in just 5 to 6 days. Rest of the time the stock might retract or go in range.

In a year you will probably find 5000 to 10000 such 3 to 5 day setups when both bullish and bearish setups are combined.
 
Set ups of course are vastly difference to a trade.
What sort of success rate would you expect?

How would you manage risk in a trade like this?
Where would your buy be? Stop etc.
What would you do if the very next day stalled or reversed back to your entry point.
Or if that happened on the 2 or third day?
How would you set your exit and when would you set it OR what would constitute a sell.

Trading Long in this case.
A successful momentum burst will lead to immediate follow through. It will go up through the day and follow through for the next 2-3 days. This kind of swing trading allows you to grow your account with very low risk. For a skilled trader I’d say the average yearly return using just this set up would be around 40%.

Risk management - typically I don’t want to lose more than 0.5% of my portfolio in one trade and sometimes I extend that to 1%. This determines my position sizing for risk management.

Buy would be on the daily when I see the 4% break out. Again I don’t take every 4% break out but those other rules have to be met (the ones that I look for in the set up - as discussed in my post). Stop is set for the low of the entry day. The next day it could stall or reverse back to your entry point but if it doesn’t touch your stop, which is the low of that entry day you are fine. The third day will let you know how this is going to fare but I am out only when my entry day stop is hit. If the trade works, I take 50% of my position in 3 days, sometimes 5 days depending on whether that stall happened on day 2 after my entry. Remaining 50% of my position I use a trailing stop based on a ten day moving average to get out.

Per trade profit on these trades will be on an average 5-8% as you are only going to get part of the 8-20% move. By the time you enter on the breakout day the stock may be up 4-10%, so you will not be able to capture that part of the range expansion move. To trade this set up you should be willing to do 200 or more trades in a year.

Just for fun - find a stock on ASX with a 30% move over 3 months - this might have completed in 2 momentum bursts of 10 to 15% in just 5 to 6 days. Rest of the time the stock might retract or go in range. In a year you will probably find 5000+ such 3 to 5 day set ups when both bullish and bearish setups are combined.
 
Essentially if you look for top gainers in the day (mostly focus on the ones that are up and over 4% - this is the range expansion day if you look at the candle. In this day volume must be higher than previous day.
Is there a % move you would leave alone on the first day.

Eg a gap and trading 10 or 20 or 30% above the open or a high range single day of say 50% plus.

Stop placement becomes an issue if the trade is well above its open.(a lot more than 4%) I guess it just
reduces your position size---is this what you do if this happens? or?--
5000 even 1000 is a lot to filter for trades. How do you do it?
Do you have a minimum price stock you'll trade or a maximum.
When you exit your trade is it on open or close or?
What if a single day moves 30% plus? (during a trade.)

I use a similar method rules are different but looking for the same.

ICI chart maybe of interest to you.
WC8 another
and BDC

All current trades for me.
 
I attached a chart that explains the momentum burst that I wrote about in the post earlier. Hope this helps.View attachment 131521

I can't particularly say I understand how you determine that a certain candle is going to be the beginning of the breakout. You say it can consolidate for 3-20 days .... ok, but are you buying on the first bullish candle in the above chart? how did you know that would be an engulfing candle? or are you buying on the day after? breakouts are notorious for failing, so without good stoploss controls (as tech has pointed out), you will just bleed cash.

Also, why keep calling it 'momentum burst' .... isn't this just breakout trading? Momentum trading is about getting on a trend as it goes up (or down), not typically 'bursts'. That kind of trading is either shorter term 'swing trading' or in the example above, breakout.
 
There are a number of patterns and trading strategies which have some similarities to this one.
Darvas
Volume Control Bars.
Basic Breakout from consolidation
A useful pattern which a few here already use a form of now.
i immediately thought of darvas. Turtle's system would be another candidate, or the donchian. Even my simple MAP strategy that I run on price/volume spikes over % trades similarly (it tends to buy on the first big bullish bar though).
 
I think it would be worthwhile doing a sysyem and backtesting it..if i get time will try..starting company and trust tax return prep and company closure, but if we get rainy days..
Thanks all for your inputs
 
Is there a % move you would leave alone on the first day.

Eg a gap and trading 10 or 20 or 30% above the open or a high range single day of say 50% plus.

Stop placement becomes an issue if the trade is well above its open.(a lot more than 4%) I guess it just
reduces your position size---is this what you do if this happens? or?--
5000 even 1000 is a lot to filter for trades. How do you do it?
Do you have a minimum price stock you'll trade or a maximum.
When you exit your trade is it on open or close or?
What if a single day moves 30% plus? (during a trade.)

I use a similar method rules are different but looking for the same.

ICI chart maybe of interest to you.
WC8 another
and BDC

All current trades for me.
Some of those gap ups I take using the earnings momentum. Anyways we can chat about that another time. For this set up, you are right the stop placement reduces my position size.

Every day, after the market opens I look for stocks up by 4% and in this screen depending on how the market does overall I'd end up looking at may be 100 charts. This exercise won't take more than 15 mins for me as am used to playing this set up. And, I don't take all those 100 trades, out of this I only take may be 3-4 stocks as long as it exhibits all those other characteristics that I mentioned in my post.

Typically the lower priced stocks move the most but I like higher priced stocks so end up playing those names where anything over 50$ because that way I can deploy more capital for the relatively lower risk if you know what I mean.

Exit the trade typically in the late afternoon before close. That said, if a single day if am in a trade where I caught a bulk of that 30% move I will take partial profits. Say I entered after 4% break out based on all the other criteria being met for the trade and if am over 10% I'd start selling some.

I am looking at ICI, WC8 and BDC - Mainly because they are penny stocks plus the set ups for this momentum burst not so much here. I don't know much about stocks listed on the ASX but I would not have traded them based on the characteristics I look for in the set up ( as explained in my post)
 
I can't particularly say I understand how you determine that a certain candle is going to be the beginning of the breakout. You say it can consolidate for 3-20 days .... ok, but are you buying on the first bullish candle in the above chart? how did you know that would be an engulfing candle? or are you buying on the day after? breakouts are notorious for failing, so without good stoploss controls (as tech has pointed out), you will just bleed cash.

Also, why keep calling it 'momentum burst' .... isn't this just breakout trading? Momentum trading is about getting on a trend as it goes up (or down), not typically 'bursts'. That kind of trading is either shorter term 'swing trading' or in the example above, breakout.
The breakout day is a range expansion day after the consolidation phase that happens after one leg up in the trend. This can be considered as a volatility contraction phase. I buy on the 4% breakout day as it happens but like I said not every 4% breakout is a buy candidate. Thats where the chart selection matters. My stops are always the low on the entry day, if it fails I am out. Just for fun, see the the top 25 or 30 performers on ASX and see when the sharp move happened. I can be sure that they all began with the 4% break out. It's easy to spot them based on the characteristics that I look for. It is shorter term swing trading but the momentum typically fades after 5 days and hence I use the term burst.
 
Stockbee's momentum burst and Mark Minervinis VCP are not copies of each other,Pradeep acknowledges Mark's similarities, he doesn't pass it off as his own.
 
No problem, i assumed the idea of the thread was to promote original trading strategies, not plaigarize someone else's strategy and try and sell it as your own.
 
Top