Hi guys,
I am interested in robust, simple systems. These are often used as trading or weighting components in an aggregated Neural Network (which I have written about here previously).
For example, in the case of this system, I might be interested in knowing how many components of an index are currently in a buy signal and this metric acts as a weighting component.
Anyway, I have recently been researching simple volatility breakouts. The three most interesting to me are the P&F pattern "Bullish Triangle Breakout", the Bollinger Squeeze setup, and also the well known Darvas Box method.
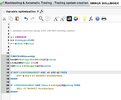
Today I wrote a very quick Bollinger Squeeze system. Here it is, in entirety:
Basically, buy closes above the upper 20 week boll band if the volatility (as measured by Bollinger Bandwidth) is <5% of Close price and exit closes below 20 week SMA.
As an unleveraged, buy only, "slow and steady" type system with 10,000 starting capital, it seems to handle itself quite well on manual backtests over the last 6 years on the ASX20, DAX30, US50 constituents. It seems to perform moderately well on the respective indices over the same timeframe.
When I say manual, I mean that I had to run the test over each instrument individually and compile the results.
To that end, as a programmer, I am looking to team up with a trader who can assist in more comprehensive backtesting of this system (, and hopefully continue to collaborate with such a person or persons here at ASF generating and testing very robust simple systems.
Some screenshots are included:
In order DAX, XJO, SPX:


Just to show some winners and losers on the same graph: BMW (DAX constituent)

I am interested in robust, simple systems. These are often used as trading or weighting components in an aggregated Neural Network (which I have written about here previously).
For example, in the case of this system, I might be interested in knowing how many components of an index are currently in a buy signal and this metric acts as a weighting component.
Anyway, I have recently been researching simple volatility breakouts. The three most interesting to me are the P&F pattern "Bullish Triangle Breakout", the Bollinger Squeeze setup, and also the well known Darvas Box method.
Today I wrote a very quick Bollinger Squeeze system. Here it is, in entirety:
Code:
TIMEFRAME(weekly)
bwidth=BollingerBandWidth[20](close)
c1=bwidth/Close  < 0.05
c2=Close > BollingerUp[20](close)

IF c1 AND c2 THEN
	BUY 5 %CAPITAL AT MARKET NextBarOpen
ENDIF

IF Close < Average[20](close) THEN
	SELL AT MARKET NextBarOpen
ENDIF
Basically, buy closes above the upper 20 week boll band if the volatility (as measured by Bollinger Bandwidth) is <5% of Close price and exit closes below 20 week SMA.
As an unleveraged, buy only, "slow and steady" type system with 10,000 starting capital, it seems to handle itself quite well on manual backtests over the last 6 years on the ASX20, DAX30, US50 constituents. It seems to perform moderately well on the respective indices over the same timeframe.
When I say manual, I mean that I had to run the test over each instrument individually and compile the results.
To that end, as a programmer, I am looking to team up with a trader who can assist in more comprehensive backtesting of this system (, and hopefully continue to collaborate with such a person or persons here at ASF generating and testing very robust simple systems.
Some screenshots are included:
In order DAX, XJO, SPX:


Just to show some winners and losers on the same graph: BMW (DAX constituent)


