Australian (ASX) Stock Market Forum

Would you mind posting a few trades real-time a few of us haven’t seen real-time use of EW

yes i would mind

mostly because i have molded the EWP into a set of set-ups, rather than trading on a whole series of wave patterns for trend investments or swing trades alone, i'll quickly define the larger structure then break it down into parts so i can define the bars that i can use, some are going to be 30 second bars some 4 hourly but takes a lot of work to define the structure and edit the story of recent trades relative to time frame i'm playing, they'll make sense to me but not the next person without them understanding the same game at that time, sometimes i simply throw the ideas away as just getting to cute or convoluted in an auction that's full of games requiring risk to be lowered to such an extent the work exceeds the reward likely available, not just the risk of dollars but the risk or time

mostly it is the dynamic of price lengths requiring time to stamp a context on them only to find out that that context is wrong, the risk has changed, so i can find a perfectly valid set-up on a "degree of trend" only to see the price length eaten away before i execute anything,
based on that alone i decided to make a series of set-ups using part of the EWP which has slowly evolved into ratio hunting yet still has a large basis of the EWP in structure

i think the thing that most people expect of the EWP that they dont ask of other (subjective) trade ideas is that the EWP is a complete form unto itself even tho most people do not understand how to apply it or have never investigated enough to correctly apply it in the first place
whereas all other trade ideas are allowed to be round-about-ish, even tho the EWP was discovered and elocuted to be dynamic with price .....people apply it linearly

i have posted a decent volume of charts showing my workings, at that trade time, still, i know that if a EWP practitioner came and went thru them without understanding the context - the relative time and price lengths - i post them on the basis of what i see unfurling and the levels where i am wrong and a whole different ball game is underway that i cannot see

i just want the pricing structure to make sense with the story i think is printing, does it fit the intent i (think i) can see
when the ratios and measure match up i have done one of three things:
1 lowered risk
2 lowered risk and defined a probably outcome or target
3 lowered risk by recognising what should not happen

if pricing is suddenly convoluted when i expect clean impulsing then i have misinterpreted the price action, or am too early
...vice versa applies
if i have summised what should be happening but the size of the price action does not fit (the degree of trend is wrong if you like)
then i am probably wrong

all these things require their own money management, applied risk verses positional risk versus trend risk

i rarely trade stocks these days, mostly xauusd and xjo cfd's
...the EWP is not a simple application of one size when that size is too rigid to make the time versus task worth the effort x the risk

as i did earlier i shall post stocks or futures that i find useful - given the time frame i am using - this is important point here:
most traders and even investors never define a time frame to work in, yet, oddly, they demand the EWP must work in a time frame they randomly apply without even applying the principal correctly themself !

coffee

olt:
none of us are equal in knowledge, yet, we are not different to each other, this is the essence of the EWP,
that alone is a useful insight to have about oneself, it is what makes up herding and impulsing trend
and when two groups of buyers and sellers cannot agree then we get a series of chops until one group
can endogenously dominate the other, this is applicable at all degrees of trend, everyone is subsumed or consumed within
 
@Joules MM1
One of the best pieces I’ve seen written on someone’s personal use of a methodology
Yeh I get it and no I don’t need to see or understand it. Agree that most are looking for definity but won’t find it

I’ve done similar with VSA
 
this stock (not held) has been run in the monthly ASF comp for several months

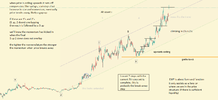
a simple impulse, clean lift where it should print, and overlapping that fits a layering uptrend

it does have an underlying driver external to it but that need not be a consideration unless you decide to use it as an extreme sentiment to fit the construct of the stock pricing

with a clean channel

it carries typical qualities and ratios, a clearly defined level to exit


an EWP count in progress
 
what comes next should make sense, should sit within the confines of the prior structure, not to predict the future rather to protect
against bias and set levels of protection, of course that is based on the extent of the practical application by the practitioner

in this instance the count is offering an idea that the market is not just letting me "off the hook" of bias, rather, todate, it clarifies that
we have more in the same direction, if anything else transpires other than the count, the larger count road map may still be intact but the nearterm construct requires levels be adhered to ( lifter to .325) and patience applied

in this instance, given the current applied count, when price over laps it is the old holders exiting on best price available on the day, we know this because this particular stock had a recent history, since the low, of having the first 3 levels in the DOM at a 1.5 to 1 ratio (bid versus offer) in most of the steps, the steps are signs of patient buyers, these types of buyers we can argue have the pockets that are not prone to jittery reflex
... so buyers were patiently waiting and when no more supply would come price would be pushed upwards, this happens until the crowd has to be in and needs to chase the available supply that is thinning out, this is a natural course for an auction, this idea about volume is within the confines of what the construct says we should be seeing, yes i agree that that is somewhat misleading, the construct is asking what does the external data offer, how does the data fit the construct and not the other way around

it is specific to this part of the construct that we can say overlapping is permissible, in all other instances overlapping is a negative sign, usually only adaptive to retracements and congestion zones, or the end of major leg where smart money has to be patient for late commers to take up what theyre selling and that paints the correct picture, it gives us confidence that if we are exiting based on the structure then we agree that the story we are applying fits the construct not the other way around

looking at todays chart, this stair-stepping is in need for a break-away to print soon, clearly that is the point of inflection that the auction is saying the cats out of the bag, you're either in or you miss out

in the 1's n 2's scenario, these are rare, if you have kept charts on an hourly basis you'll find them, theyre worth researching, a warning,
in realtime you can be ahead of what price is telling you, that's not the fault of the principal, so when you see a series of ones and two's without correct context you'll see in them what confirms your bias, you are confirming your bias not the EWP

in retracements and congestion the overlapping is confirming firstly that we have exited an impulse or we're within an interruption to that impulse leg, either way ideas about what should happen within the confines of the structure alone need to be defined for protection and if a decision needs to be made for scaling, or what likely levels we should expect to see for any additional entries

in this chart, todate, we have a simple impulse leg up, with a running flat correction, followed by what should be a wave 3, which contains a series of tight steps

running flats are a clear indicator of intent within the auction to get going north, it is anticipatory without the necessary legs (volume and commitment by money that matters) there are usually markers, theyre contextual, in this instance the running flat is a simple ABC where the C leg equals the A leg at 100% - this is common, ratios that are in context assist the outlook in defining probabilites that the annotations are correct todays and what is likely to come next, again, if we veer away from that count and context then we should know to what to look for, to avoid complacency and risk, traders make a running flats so do investors trader make weak price discovery whereas investors comes in and support price at the end of the running flat, we should expect to see this activity

please bare with while i get some of this onto the page, seeing and knowing are a far stretch from explaining, eek!

if we place into context the very clean first leg up, followed by a well constructed running flat and a series of stair-steps higher, it is not
unwise to anticipate the next move to be swift in the trend direction, the construct should now confirm that we are in a series of 3's
(if you have 6 steps that should translate to 6 legs of widening 3's and the volume and momentum commensurate), this coinstruct should also offer a concise level to protect or exit on, different to a level where we might consider adding on a discount

it is vitally important to get away from the idea of prediction and into the idea of workable progress, sure we can look for targets and work congestion zones with ratios, build context for forward looking, these things are about protection, hence the reason that all counts be accompanied with an alternate count, the alternate count stands in as a what-if, sometimes the construct can be viewed in several ways so we need an alternative probability in mind for when suddenly breaks down and does something different to the road map, again this requires its own context and relative size of moves that are printing

players who use the EWP to be aggressive need to be extremely well versed in the principle at all degrees of trend and have all forms in their memory, other than that, all standard trading governance applies (hint: if you lack good trader governance you'll be bad at EWP)

one small advantage is the saying "when the moves over the moves over"
that means when a construct has completed it should not travel any further specific to the construct we have, there is nothing arbitrary or subjective about this, it is a completed construct, therefor anything printing beyond that construct (at all degree of trend) is a large warning sign you are not seeing the chart or price activity correctly, it should refocus you to question your road map, or, at least some part of that road map needs to be re-assessed, i suspect in all instances better to put that trade set aside and come back after time away.

we could look at this chart and project price, not a great idea right now i dont think, mostly we need to be focused on the channel and the count and that price remains within the confines of the channel and the construction prints in successive steps higher, given the news background, the probabilities of extended uptrend look very promising, the SPA today closed fractionally below the high, volume can be seen in several ways, is subjective of itself, one thing we can say is that price cannot ascend without decent supply and have a healthy price construct, these two ideas are self-affirming, if price was racing uphill but the volume (in the current construct) was very thin i would be warey of what is going on, ( let's not be naive, those are not investors, the opposite is taking place, so it maybe a warning signal to be quick to exit when the exit signal comes, the EWP does not print on any particular traders time frame, just like the auction it doesnt care if youre on the ball or not!) when the auction becomes a little heavy on the offer side that allows buyers to get ample supply, we still have an instance of players exiting "because it can't go any higher[surely!]" and those players are keen to bank coin

with the construct of MLX in hand i am inclined to sit shtoom, let the price tell me what it is doing, the idea of workable progress is to have the price dictate actions......

there are many competing ideas about volume, it can be argued that volume does not play a role in EWP, i think its a useful tool as a secondary consideration, in other words the EWP subsumes all other considerations and is the final decision maker, in that regard any facility (indicia, volume, clustering etc) can be assisting in framing what makes sense as you gain experience, theyre secondary

the only tool i have used, with instruments that have good volume, are ratios, not to be confused with (point to point) Fibonacci,
this has been very good entry and exit tool, not just for transactional pricing, rather for construct, it adds to specificity, takes me away from
holding onto a long piece of string .....

as i have proposed this stock for this thread i thought to put MMWMMI and bought some at 0.360's, i was not concerned if it pulled slightly which it did to 0.330's, well within the confines of the construct, rather i was more concerned that i was running out of excuses when i have already said outloud that this is a decent risk/reward proposition

price for this instrument should not print below 0.325 in the current cycle

small caveat here, having bought at 36's with a stop out at 325's that's a sizeable % drop right?
this is the risk versus reward moment, given the late entry, how well does the construct support this risk?

EWP can only reveal what is transpiring within the auction, keeping in mind that all degrees of trend are active at all times, it is the traders job to know they have enough data, the instrument is liquid enough, they understand how to apply the principal, that prediction is about them and not the method, you predict - the EWP merely reflects to you what you want to receive when misapplying ...sometimes ya gunna be wrong, every single method on the planet is sometimes gunna be wrong, every method takes a drawdown, repeatability is the key, if the EWP does not make sense to you then that is all you need to know, then you can immediately move onto a method that best "fits" you

EWP has a series of rules and guidelines
rules cannot be adjusted or muted, guidelines can be twofold: expectant and transient, in all instances we are looking for form and construction,
price lengths have their part, they are governed by form, this is not the same as round-peg-square-hole, form encompasses construct
within the impulse or corrective set, they are endogenous, this allows you to have empirical empathy for what is printing, youre allowing
price to dictate (trans)actions while educating yourself on what should not be happening and contextualise the size of the move so you can take advantage of what is happening

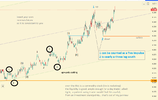
in this chart below if the series of higher highs and higher lows are broken they have a specific message and changes the whole outlook,
... without this construct build we may be of the notion to just hang in there, it'll come back

mxl EWP follow-up 141021.png

mlx EWP follow-up close up 141021.png

what is the difference between a paraglide, a hangglider, a single prop, a twin-prop, a jet, 737
if you want to fly somewhere, regardless the destination, the appropriate transport is key
you would never confuse any of them with a helicopter or a drone,
the difference be tween a directional and anti-directional trade
surgeons have a specific language for surgery
the more risk taken on the more specific the requirement of inspection needs to be
and it needs to be empathetic to a dynamic price in the same way a 737 pilot would deal with windsheer
 
what comes next should make sense, should sit within the confines of the prior structure, not to predict the future rather to protect
against bias and set levels of protection, of course that is based on the extent of the practical application by the practitioner

in this instance the count is offering an idea that the market is not just letting me "off the hook" of bias, rather, todate, it clarifies that
we have more in the same direction, if anything else transpires other than the count, the larger count road map may still be intact but the nearterm construct requires levels be adhered to ( lifter to .325) and patience applied

in this instance, given the current applied count, when price over laps it is the old holders exiting on best price available on the day, we know this because this particular stock had a recent history, since the low, of having the first 3 levels in the DOM at a 1.5 to 1 ratio (bid versus offer) in most of the steps, the steps are signs of patient buyers, these types of buyers we can argue have the pockets that are not prone to jittery reflex
... so buyers were patiently waiting and when no more supply would come price would be pushed upwards, this happens until the crowd has to be in and needs to chase the available supply that is thinning out, this is a natural course for an auction, this idea about volume is within the confines of what the construct says we should be seeing, yes i agree that that is somewhat misleading, the construct is asking what does the external data offer, how does the data fit the construct and not the other way around

it is specific to this part of the construct that we can say overlapping is permissible, in all other instances overlapping is a negative sign, usually only adaptive to retracements and congestion zones, or the end of major leg where smart money has to be patient for late commers to take up what theyre selling and that paints the correct picture, it gives us confidence that if we are exiting based on the structure then we agree that the story we are applying fits the construct not the other way around

looking at todays chart, this stair-stepping is in need for a break-away to print soon, clearly that is the point of inflection that the auction is saying the cats out of the bag, you're either in or you miss out

in the 1's n 2's scenario, these are rare, if you have kept charts on an hourly basis you'll find them, theyre worth researching, a warning,
in realtime you can be ahead of what price is telling you, that's not the fault of the principal, so when you see a series of ones and two's without correct context you'll see in them what confirms your bias, you are confirming your bias not the EWP

in retracements and congestion the overlapping is confirming firstly that we have exited an impulse or we're within an interruption to that impulse leg, either way ideas about what should happen within the confines of the structure alone need to be defined for protection and if a decision needs to be made for scaling, or what likely levels we should expect to see for any additional entries

in this chart, todate, we have a simple impulse leg up, with a running flat correction, followed by what should be a wave 3, which contains a series of tight steps

running flats are a clear indicator of intent within the auction to get going north, it is anticipatory without the necessary legs (volume and commitment by money that matters) there are usually markers, theyre contextual, in this instance the running flat is a simple ABC where the C leg equals the A leg at 100% - this is common, ratios that are in context assist the outlook in defining probabilites that the annotations are correct todays and what is likely to come next, again, if we veer away from that count and context then we should know to what to look for, to avoid complacency and risk, traders make a running flats so do investors trader make weak price discovery whereas investors comes in and support price at the end of the running flat, we should expect to see this activity

please bare with while i get some of this onto the page, seeing and knowing are a far stretch from explaining, eek!

if we place into context the very clean first leg up, followed by a well constructed running flat and a series of stair-steps higher, it is not
unwise to anticipate the next move to be swift in the trend direction, the construct should now confirm that we are in a series of 3's
(if you have 6 steps that should translate to 6 legs of widening 3's and the volume and momentum commensurate), this coinstruct should also offer a concise level to protect or exit on, different to a level where we might consider adding on a discount

it is vitally important to get away from the idea of prediction and into the idea of workable progress, sure we can look for targets and work congestion zones with ratios, build context for forward looking, these things are about protection, hence the reason that all counts be accompanied with an alternate count, the alternate count stands in as a what-if, sometimes the construct can be viewed in several ways so we need an alternative probability in mind for when suddenly breaks down and does something different to the road map, again this requires its own context and relative size of moves that are printing

players who use the EWP to be aggressive need to be extremely well versed in the principle at all degrees of trend and have all forms in their memory, other than that, all standard trading governance applies (hint: if you lack good trader governance you'll be bad at EWP)

one small advantage is the saying "when the moves over the moves over"
that means when a construct has completed it should not travel any further specific to the construct we have, there is nothing arbitrary or subjective about this, it is a completed construct, therefor anything printing beyond that construct (at all degree of trend) is a large warning sign you are not seeing the chart or price activity correctly, it should refocus you to question your road map, or, at least some part of that road map needs to be re-assessed, i suspect in all instances better to put that trade set aside and come back after time away.

we could look at this chart and project price, not a great idea right now i dont think, mostly we need to be focused on the channel and the count and that price remains within the confines of the channel and the construction prints in successive steps higher, given the news background, the probabilities of extended uptrend look very promising, the SPA today closed fractionally below the high, volume can be seen in several ways, is subjective of itself, one thing we can say is that price cannot ascend without decent supply and have a healthy price construct, these two ideas are self-affirming, if price was racing uphill but the volume (in the current construct) was very thin i would be warey of what is going on, ( let's not be naive, those are not investors, the opposite is taking place, so it maybe a warning signal to be quick to exit when the exit signal comes, the EWP does not print on any particular traders time frame, just like the auction it doesnt care if youre on the ball or not!) when the auction becomes a little heavy on the offer side that allows buyers to get ample supply, we still have an instance of players exiting "because it can't go any higher[surely!]" and those players are keen to bank coin

with the construct of MLX in hand i am inclined to sit shtoom, let the price tell me what it is doing, the idea of workable progress is to have the price dictate actions......

there are many competing ideas about volume, it can be argued that volume does not play a role in EWP, i think its a useful tool as a secondary consideration, in other words the EWP subsumes all other considerations and is the final decision maker, in that regard any facility (indicia, volume, clustering etc) can be assisting in framing what makes sense as you gain experience, theyre secondary

the only tool i have used, with instruments that have good volume, are ratios, not to be confused with (point to point) Fibonacci,
this has been very good entry and exit tool, not just for transactional pricing, rather for construct, it adds to specificity, takes me away from
holding onto a long piece of string .....

as i have proposed this stock for this thread i thought to put MMWMMI and bought some at 0.360's, i was not concerned if it pulled slightly which it did to 0.330's, well within the confines of the construct, rather i was more concerned that i was running out of excuses when i have already said outloud that this is a decent risk/reward proposition

price for this instrument should not print below 0.325 in the current cycle

small caveat here, having bought at 36's with a stop out at 325's that's a sizeable % drop right?
this is the risk versus reward moment, given the late entry, how well does the construct support this risk?

EWP can only reveal what is transpiring within the auction, keeping in mind that all degrees of trend are active at all times, it is the traders job to know they have enough data, the instrument is liquid enough, they understand how to apply the principal, that prediction is about them and not the method, you predict - the EWP merely reflects to you what you want to receive when misapplying ...sometimes ya gunna be wrong, every single method on the planet is sometimes gunna be wrong, every method takes a drawdown, repeatability is the key, if the EWP does not make sense to you then that is all you need to know, then you can immediately move onto a method that best "fits" you

EWP has a series of rules and guidelines
rules cannot be adjusted or muted, guidelines can be twofold: expectant and transient, in all instances we are looking for form and construction,
price lengths have their part, they are governed by form, this is not the same as round-peg-square-hole, form encompasses construct
within the impulse or corrective set, they are endogenous, this allows you to have empirical empathy for what is printing, youre allowing
price to dictate (trans)actions while educating yourself on what should not be happening and contextualise the size of the move so you can take advantage of what is happening

in this chart below if the series of higher highs and higher lows are broken they have a specific message and changes the whole outlook,
... without this construct build we may be of the notion to just hang in there, it'll come back
An interesting post. I find some of the language you use a little hard to follow but the logic is clear. You drill right down into EW and that's good but after studying the subject and finding EW's fine detail impossibly difficult to follow in real time because counts can be easy to see with hindsight but tough when trying to look ahead at anything more than the general direction - ie where on the current price cycle am I?
I'm not in MLX but have been watching it and as an academic exercise I thought I'd see if I would have bought in on your $0.36 trade and the answer was - probably not as I saw the risk outweigh the reward. Of course I don't know what your profit aspirations were as to time or return and after yesterday you are up 10% and perhaps that was your target. If so, well done, as it is hard to sneeze at a quick 10% profit, but for what it is worth here's my thoughts.
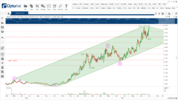
As per the chart below I'd say we're pretty close to the top of W5 with the recent retracement being a sub-wave 4 of said W5. I see price rising in the shaded channel and my view would be that MLX is running out of puff and while there may be a bit of overshoot of the channel top boundary I'd be suspecting it could fall bag significantly.
Back to EW, when I look at the big picture (all the historical data available) I'm thinking this current wave is a larger Wave 1 and if so price might now fall away into W2. It's hard to determine wave length as they can vary so much - ie W1 might run for 12 months in one cycle and 4 years in a prior cycle (as MLX did) - but the current wave from C to 5 looks too short to be anything than W1 of a bigger cycle.
Just my thoughts and as always, time will prove who is right and who is wrong. I wish you luck with your trade and keep your analysis coming.

1634246659883.png
 
Spent sometime reading through the logic with the various counts.
As always with E/W the counts can and do alter over time. To trade from
the hard right hand edge with so much subjectivity I found Nigh on impossible.

I purchased Advanced get about 8 years ago and found the algo's helpful in particular identifying wave 3 s
but even so it was still a discretionary trading method using a trade identification mechanism ---A-Get.

While I agree it does help with structure I found that if it wasn't painfully obvious it never was going to be.
I just couldn't justify time for reward and found other technical tools less subjective and much easier to
apply with better accuracy when anticipating a move or structuring a trade.
 
What, you didn't like my EW interpretation of @finicky 's "bouncey, bouncey call on CHN? It was seconded by Joules (my interpretation, not the bouncey one).
 
continuing with the $mlx (holding) annotation


the 13 steps are unusual and not outside the rules, the instrument greatest influence is the commodity sector, nuances differ
structurally in some degrees of trend*, but, structure can take any form that stays within the rules,
the larger degree message should be clear, as is the case with MLX, we still have several larger degrees to travel in this up-cycle
.. i suspect a momentum thrust due soon

*excepting the GSC degree does not print for commods

as price is merely printing "more of the same", inline with what structure calls for, thus far, this is as live a profile as is needed
 
$mlx
momentum has "more" focus within specific parts of an uptrend, theyre far less likely to incur
large rotations and any sudden swings that do hit, like we saw this week, are quickly consumed (by buyers in the uptrend)
the difference (the construct is defining) between final buying opportunity (reducing risk) and weeding out the weak holders

momentum should fit the construct

 
$mlx price may want to take some time to track sideways as expansion taps the roof of the channel, structure says we have a few more shekels to go, if we close above the channel we can expand x 2

the above (december 7th) was based on burst into the top of the orthodox channel
the count at the high can be annotated in several ways so am not in rush to get ahead of what price is saying, however it was clear that
we had a momentum peak, seasonal coin bank and peak in sentiment,

price is currently the most extended of all pullbacks and "looks" typical of a whipsaw pullback in a healthy trend, if we look at the volume from a price-structure point of view (as opposed to market or volume structure) the node at .040's would act as a magnet, price rotating back north above 0.400's would add to the bull construct as that's saying demand meets supply printing a new node that fits with price structure

it's a commodity stock, prone to compression and energy release, with the prior annotations still valid, no point in predicting as the current count is open to interpretation, i have no clear reason to close the holding, let it run, gmtfo at 0.365's

as with all interpretations about trend, which are all subjective, all speculative, everything valuable is in the price, prior to everything else
 
added today at .460's
fast pullback, may not be complete, risk remains 0.365's
a ratio between two points is rarely reliable, there's one there, again, not typical of commods, however, in emotive structures
doesnt matter the sector, could be any instrument
as the current holding is well in the green, adding on pullback, which is the largest todate, well within the current up channel, makes sense
 
Top