Australian (ASX) Stock Market Forum

ASX200 components: A.I. predictions of short term trend

Joined
30 June 2021
Posts
24
Reactions
19
Hi there, I'm going to post here daily, for a few weeks, my AI generated predictions for the ASX200 components.

  • What data is used?
Only End-Of-Day trading data is used (Open, High, Low, Close, Volume)

  • What is predicted?
The percentage change in the simple-moving-average of the last 5 days (MA5) vs the MA5 calculated 5 trading days into the future.
For example, if today is Friday, today's MA5 will be calculated over the most recent 5 days (Mon-Tue-Wed-Thu-Fri) and the prediction will be the percentage change in MA5 today vs MA5 calculated next Friday.

  • How to read the prediction?
The primary components of the prediction [Move Probabilities and Average Magnitude] will give you the Probability/Chance of a move together with the statistical mean of the magnitude of the move. Primary components are split in Win/Neutral/Loss. Of course Win/Loss different meaning depending on the position taken Long/Short.
The primary components are summarised in a single figure [Directional % Change] to give the statistical magnitude of the predicted change + for Increase and - for Decrease.

  • What is the algorithm used?
I use a machine learning algorithm that has 38 inputs, all based on technical indicators that are derived from the EOD data.

  • How big is the data used for training / testing the ML algorithm?
EOD data has been collected for a few thousands stocks across EU/US/AUS for the 1998 - 2022 (or shorter) period so the ML algorithm has learnt both from good times and bad times. In total I have a bit over 6 million patterns for training and 2 million for validation.

  • What R-squared did you get on the validation data?
Explained Variance Score is 0.34349
R2 Score is 0.34348

  • How often will you be posting the predictions
For the next 4 weeks, I'll make sure to post once a day (Mon-Fri) either 1 hour after the close of ASX or the next trading day before 8am

  • Why am I doing this?
There are a few reasons that come to mind: validation of the algorithm, feedback, socialising while in isolation...

I attach here the prediction file I've generated yesterday after the close just to be used as an example. I'll post again today after the close when todays EOD is available.

Note: I don't give any promises regarding those predictions, investment in stock market is a high risk activity and majority of short term traders lose in the long run.


Cheers.
 

Attachments

  • asx200_forum.pdf
    429.7 KB · Views: 11
Hi Peter, thanks for the reply. I'm currently in the live test / paper trading stage with this project. My plan is to trade turbo certificates (with knock-out barrier) on indexes DAX/DJIA/SP500/NASDAQ.

Emil
 
Turbo certificates heh? You're not from around here.

Why don't you post your algo results for the indicies instead of the ASX200? Many of us here monitor these indicies also. A smaller sample set is easier for others to follow along.
 
Turbo certificates heh? You're not from around here.

Why don't you post your algo results for the indicies instead of the ASX200? Many of us here monitor these indicies also. A smaller sample set is easier for others to follow along.
Hi Peter,

I've only started collecting data on the 22.06 and on 29.06 I've change the algorithm - I believe that it's good now. The day highlighted in orange is when the new algorithm went into test.

I haven't decided on the value of "Win" when to enter yet but the plan is:
1) enter long when Win column is above, say, +1% or enter short when Win is under, say, -1%
2) keep position while the "Win" column confirms that position
3) exit as soon as it turns around / changes sign.


Emil
 

Attachments

  • all_forum.pdf
    415.2 KB · Views: 11
ASX200 as of 30.06.2021 - End-of-Day

Looks a bit directionless....
 

Attachments

  • asx200_eod_300621.pdf
    429.8 KB · Views: 6
What are you going to benchmark yourself against?

I'd recommend some already accepted industry standard like the MACD.
 
What are you going to benchmark yourself against?

I'd recommend some already accepted industry standard like the MACD.
MACD is already one of the inputs and it won't give accurate picture.

I am collecting predictions every day (indexes only) and once I have enough data, that I'll collect in the next few months, I'll check the correlation coef and R2 between predicted and actual. Actual will be the actual (index) [ MA5_in5days / MA5_today - 1 ]
 
I've updated short term prediction for the indexes that I follow with the latest EOD data as of 01.07.2021 - 8:00am

The prediction is summarisation of individual stock prediction as I've described in the first post.

There is one problem: I don't have the individual stock weight within the index, so each stock has an equal weight in the final calculation.

If somebody can point me to a site where I can get the weight within an index of each component I would appreciate it.

Cheers.
 

Attachments

  • summary_forum.pdf
    415.9 KB · Views: 2
I've updated the trend calculation for all indexes to include the individual security weight rather than equal weight as before.

This will be used from now on as what I had before wasn't quite right. Data as been update for 01.07.2021 with the new calculations.
 

Attachments

  • index_ma5_trend.pdf
    416.2 KB · Views: 8
ASX200 predictions after EOD on 01.07.21
 

Attachments

  • asx200_eod_010721.pdf
    439.4 KB · Views: 7
index trend update as of this morning
 

Attachments

  • index_ma5_trend_020721.pdf
    416.8 KB · Views: 3
EOD 02.07.2021 update for ASX200
 

Attachments

  • asx200_eod_020721.pdf
    439.5 KB · Views: 5
Index trend update for EOD Friday 02.07.21.

Next update will have only the new format but the information provided hasn't changed.

The reason for the updated format is to include the actual (MA5_in5days / MA5_today - 1). This figure will be calculated with a 5-day lag as it needs the actual close for the indexes in order to compute the MA5_in5days. In the same row of the report there will be the Predicted and Actual values of MA5 trend for easy comparison.

First values in this column will first show up on Wed 07.07.21 and it will be for 30.06.21.
 

Attachments

  • index_ma5_trend_030721.pdf
    417.3 KB · Views: 3
  • new_format_index_ma5_trend_030721.pdf
    433.5 KB · Views: 3
ASX200 estimates on 05.07.2021 after EOD.

Interesting SYD.AX today, strong signal that MA5 over the following 5 days will go up quite a bit, although the price itself might not.
 

Attachments

  • asx200_eod_050721.pdf
    439.4 KB · Views: 5
Last edited:
Only DAX and ASX200 today as the US Markets were closed for the 4-th of July celebrations.
 

Attachments

  • index_ma5_trend_060721.pdf
    436.6 KB · Views: 4
For those who want to understand the reason for [Move Probabilities and Average Magnitude] columns....
probs.png

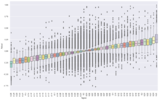
No stock market prediction will ever be perfect, good predictions are very close to the Actual value more often than not and the Actual value will form a distribution around the Predicted [Signal]. Different levels of the Signal will have different distributions. For those who have heard about boxplots, here is my Predicted (or Signal) vs Actual.

boxplot.png
 
Top