- Joined
- 13 August 2006
- Posts
- 862
- Reactions
- 1,042
It's the end of the financial year and I am looking to add some ASX index tracking ETFs during the next year. I already hold A200 but have been thinking about getting into VAS since it is so popular.
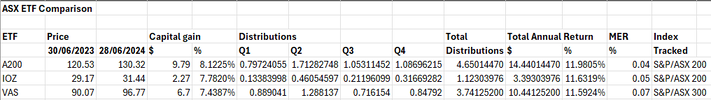
There's plenty of data on ETF performance, but I thought I'd do my own check on the main ASX tracking ETFs. Here is my rough comparison for the last 12 months:

So what are my conclusions?
Firstly, I've only looked at one year. VAS trailed the other two, but it tracks the ASX 300 and the other two track the ASX 200. The ASX 200 outperformed the ASX 300 this year, but it may be that next year the ASX 300 performs better lifting VAS. I note that over a 10 year period the difference in these two indices is insignificant.
I understand that VAS tries to enhance its performance by loaning out its holdings. I don't think the other two do this. This seems to work for VAS since the difference in total return between IOX and VAS is smaller than the difference in performance between the ASX 200 and the ASX 300. The performance advantage is being masked by the underperformance of the ASX 300.
In terms of ETF price, A200 has outperformed the ASX 200 index that it tracks. This must be some quirk in the closing prices of A200 at the start and end of the financial year which has given it a head start?
A200 and IOZ both track the ASX 200, but A200 performed significantly better. I guess A200's class leading MER is giving it an advantage here, but A200's quirky head start must also be a factor. VAS' highest MER must also be a brake on its performance.
My analysis is crude and doesn't consider any differences in franking credits and cost base adjustments. I'm going to assume these are similar for the three ETFs, but this could be wrong.
Based on my analysis I'm going to rank my preferences 1st A200, 2nd VAS, 3rd IOZ. I want to diversify into VAS, but my check doesn't support this. For ASX exposure, I think I will keep adding to A200 whilst keeping an eye on any MER reductions by its competitors.
I'll do a similar comparison next year. I'll be particularly interested to see if the quirk in A200's capital gain reverses and what happens if the ASX 300 matches or outperforms the ASX 200.
There's plenty of data on ETF performance, but I thought I'd do my own check on the main ASX tracking ETFs. Here is my rough comparison for the last 12 months:
So what are my conclusions?
Firstly, I've only looked at one year. VAS trailed the other two, but it tracks the ASX 300 and the other two track the ASX 200. The ASX 200 outperformed the ASX 300 this year, but it may be that next year the ASX 300 performs better lifting VAS. I note that over a 10 year period the difference in these two indices is insignificant.
I understand that VAS tries to enhance its performance by loaning out its holdings. I don't think the other two do this. This seems to work for VAS since the difference in total return between IOX and VAS is smaller than the difference in performance between the ASX 200 and the ASX 300. The performance advantage is being masked by the underperformance of the ASX 300.
In terms of ETF price, A200 has outperformed the ASX 200 index that it tracks. This must be some quirk in the closing prices of A200 at the start and end of the financial year which has given it a head start?
A200 and IOZ both track the ASX 200, but A200 performed significantly better. I guess A200's class leading MER is giving it an advantage here, but A200's quirky head start must also be a factor. VAS' highest MER must also be a brake on its performance.
My analysis is crude and doesn't consider any differences in franking credits and cost base adjustments. I'm going to assume these are similar for the three ETFs, but this could be wrong.
Based on my analysis I'm going to rank my preferences 1st A200, 2nd VAS, 3rd IOZ. I want to diversify into VAS, but my check doesn't support this. For ASX exposure, I think I will keep adding to A200 whilst keeping an eye on any MER reductions by its competitors.
I'll do a similar comparison next year. I'll be particularly interested to see if the quirk in A200's capital gain reverses and what happens if the ASX 300 matches or outperforms the ASX 200.
")